
Rugby union is almost an unrecognisable sport from the one which saw its first Test match played back in 1871. In fact, the last 35 years alone — since the inaugural Rugby World Cup in 1987 — have seen the sport evolve at a remarkably rapid rate. We take a look at the major ways in which rugby union has evolved.
There are clearly a few obvious factors that can be attributed to the rapid evolution of rugby union. Frequent law revisions, as well as the seismic decision to make the sport professional in 1995, have led to well-documented changes across the sport.
But our unique Rugby World Cup database allows us to dig deeper. We have analysed each of the 374 games in the tournament’s illustrious history – prior to the 2023 edition – providing us with the capability to see how the game has changed from a performance perspective and what that means for teams and players. Through the lens of this World Cup data, let’s explore how the game of rugby union has been revolutionised.
More Ball-In-Play Time
One of the most easily identifiable changes is that ball-in-play time has increased over the years.
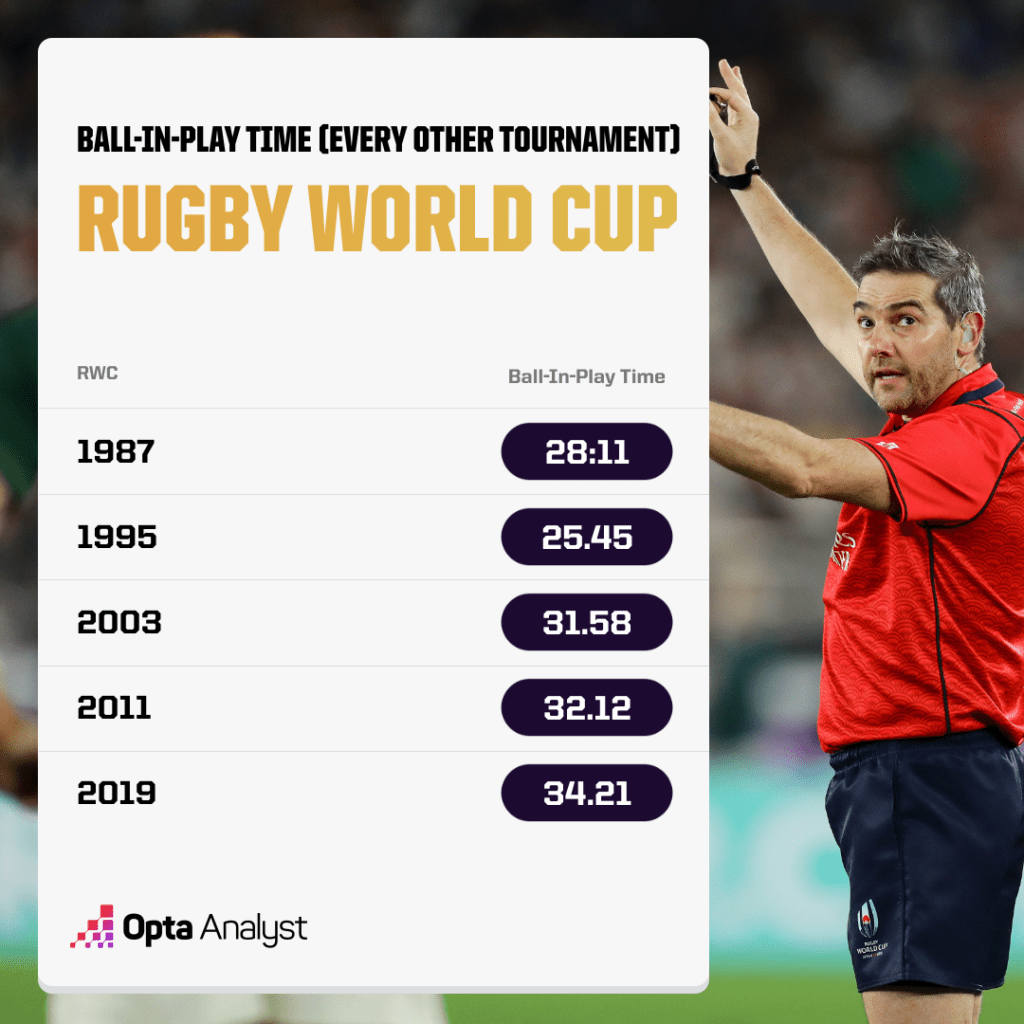
Looking at the tournament in eight-year periods, the 1987 and 1995 editions both saw less than 30 minutes of ball-in-play time. The 1995 Rugby World Cup saw just 25 minutes and 45 seconds of ball-in-play time, compared to 34 minutes and 21 seconds in 2019 — a 33% increase. This defies a common misconception levelled at the modern game — that laborious set pieces are seeing a reduction in live action.
At the Set-Piece Scrums and Lineouts Plummet
Much is made about the time taken to complete set pieces in the modern game, particularly at the scrum. In the early editions of the Rugby World Cup, the scrum was mainly a means of restarting the game rather than the longer and more tactical process it has become in the modern game.
| Rugby World Cup | Scrums Per Game | Scrum Win % | Scrum Pens Per Game | Lineouts Per Game | Lineout Win % |
|---|---|---|---|---|---|
| 1987 | 32 | 89% | 2.9 | 45 | 68% |
| 1991 | 31 | 93% | 3.5 | 39 | 69% |
| 1995 | 23 | 95% | 2.3 | 37 | 73% |
| 1999 | 22 | 92% | 4.3 | 31 | 82% |
| 2003 | 22 | 92% | 3.5 | 34 | 80% |
| 2007 | 19 | 90% | 2.6 | 31 | 81% |
| 2011 | 17 | 88% | 4.8 | 24 | 82% |
| 2015 | 13 | 88% | 4.4 | 26 | 87% |
| 2019 | 14 | 95% | 3.7 | 25 | 91% |
However, the sheer volume of scrums and lineouts in the early editions of the Rugby World Cup actually reduced the amount of play time in a game. In total, there was an average of 77 scrums or lineouts per game in the inaugural edition of the tournament, almost twice as many as the most recent tournament (39).
Another clear trend from the data shows the consistent increase in lineout success rate. From 1987 to 1995, between 68% and 73% of all lineouts were retained by the throwing team, a rate that jumped to 82% in 1999, just after lifting had been legalised. Since the 1999 edition lineout success rate has remained at 80% or above, peaking in 2019 at 91%.
Scrums have seen changes too, but success rates have remained relatively consistent over time. Repeated tweaks to the laws at the scrum could go a way to explaining why the number of scrum penalties per game has both risen and fallen over the years, with World Rugby trying to create safer and quicker scrums while still maintaining a fight for possession.
Getting Physical — Tackles, Carries and Rucks Soar
As the game has evolved so has the physicality of the players, with the average present-day player weighing as much as, or more than, a ‘heavy’ player in the 1980s and early 1990s.
Modern players also boast greater fitness levels, allowing for higher-intensity games with longer periods of continuous play. This has had a direct knock-on effect on the product we see on the pitch.
| Rugby World Cup | Avg. Carries / Team | Avg. Tackles / Team | Tackle Success % | Avg. Rucks / Team |
|---|---|---|---|---|
| 1987 | 86 | 48 | 70% | 25 |
| 1991 | 77 | 52 | 75% | 29 |
| 1995 | 78 | 58 | 76% | 38 |
| 1999 | 93 | 82 | 81% | 57 |
| 2003 | 107 | 96 | 81% | 68 |
| 2007 | 80 | 84 | 87% | 65 |
| 2011 | 99 | 98 | 88% | 77 |
| 2015 | 113 | 119 | 85% | 83 |
| 2019 | 115 | 129 | 84% | 82 |
In the pre-professional Rugby World Cup era the average team made 134 combined carries and tackles per game, a stark contrast to the last two editions where teams made well over 200 in the average match. In fact, Exeter Chiefs and Scotland second row Jonny Gray made 43 tackles in a single PRO14 match for Glasgow against Leinster in 2019 – that tally was almost as many as an entire team at the 1987 Rugby World Cup.
Similarly, the total number of rucks in a game has risen dramatically, with the breakdown becoming a major focus in today’s game. During the 2019 Rugby World Cup, Maro Itoje’s total of 66 rucks against New Zealand in the semi-final was the most any player made in a match at the tournament. His individual effort was more than the average of both teams combined during an entire game in 1987 and 1991, and greater than the average number of rucks made by individual teams in both 1995 and 1999.
Tackle success rates have also risen over the course of the nine editions of the Rugby World Cup, the inaugural edition seeing 70% of attempted tackles completed, peaking at 88% in 2011 and remaining well above 80% since.
Again, increases in the size and physicality of players could partly explain the improvements in this area. There are fewer mismatches in a modern rugby match – faster and fitter forwards make it harder for backs to exploit gaps in the defensive line while bigger and stronger backs make it more difficult for forwards to run over the top of them.
Defensive systems have improved too, helping defenders to come out on top more often than before, utilising greater line speed to snuff out early attacks and improving general organisation within open play.
In the Box Seat — The Kicking Game
The way in which teams play has changed a lot over the years, and the kicking game is no exception. Below, we look at the ratio of kick types every eight years at the Rugby World Cup. At the earlier editions of the tournament, kicking for territory was the favoured option, with roughly half of all kicks going deep and long. While kicking for territory is still the most favoured kick type, it now makes up less than a third of all kicks as teams evolve their kicking game.
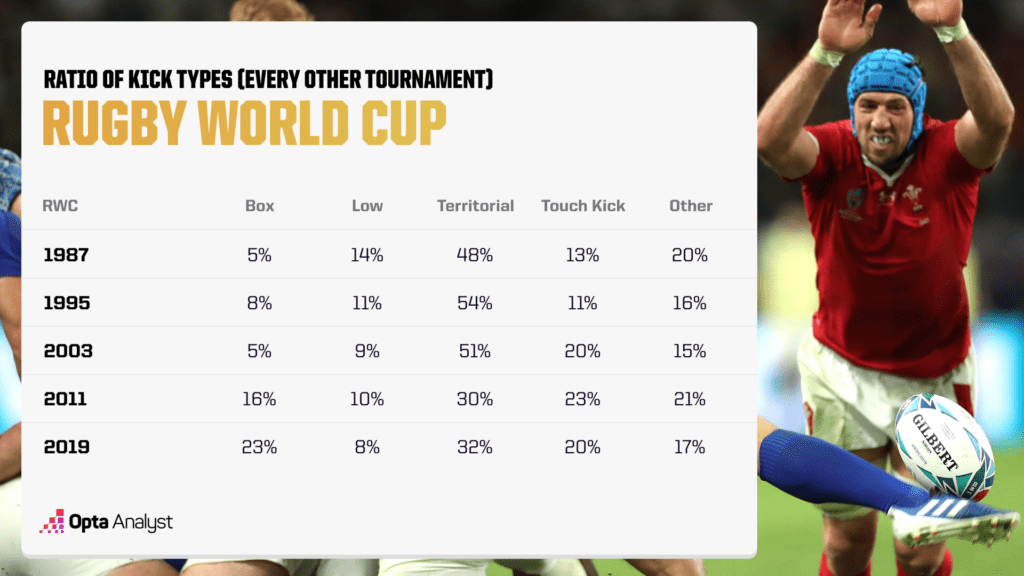
Box kicking has seen the most dramatic rise over the course of the Rugby World Cup. In 1987, one in every 20 kicks could be classified as a box kick, compared to almost a quarter of all kicks at the tournament in Japan. Hanging the ball high from the base of a ruck or maul with an organised chase is now a popular method, allowing wingers time to contest the ball and defensive systems to get organised, snuffing out any potential counter attacks early.
Playing the Percentages
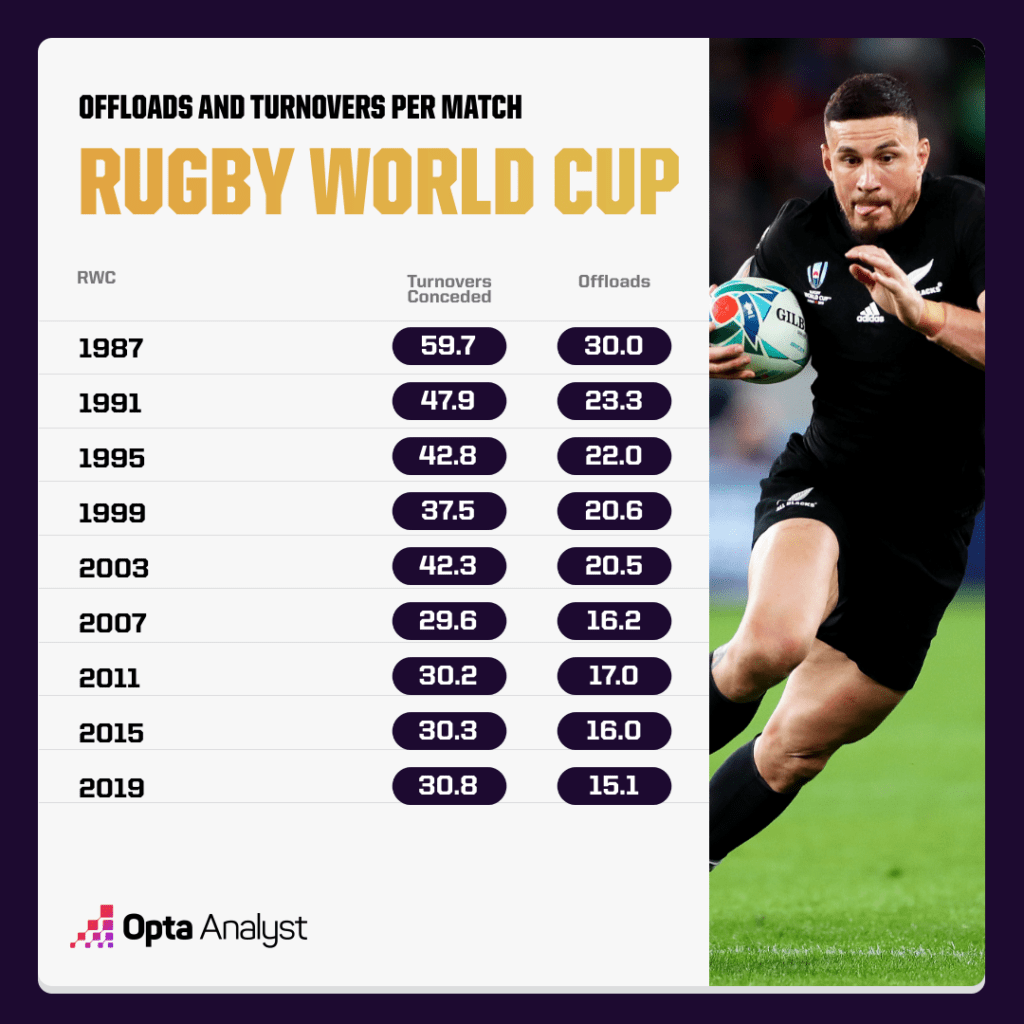
Teams are now opting to play a lower risk form of rugby. The inaugural World Cup saw 30 offloads per match – double the total of the 2019 tournament – and passes out of contact have declined almost every year, except for a slight resurgence in 2011.
Unsurprisingly, there has been a strong correlation between this risk-averse style of play and the number of turnovers conceded per game. Once again, the total conceded in the 2019 Rugby World Cup was almost half of the 1987 edition – though this has remained steady since 2007.
The lower number of turnovers has had an effect on the number of possessions in an average match, as well as the average number of phases in a possession. In 1987 there were over 130 separate ‘possessions’ in a match due largely to the high number of turnovers, with teams going through 1.4 phases on average before their possession ended.
| Rugby World Cup | Matches | Possessions Per Game | Avg. Phases Per Possession |
|---|---|---|---|
| 1987 | 32 | 134.2 | 1.4 |
| 1995 | 32 | 114.4 | 1.7 |
| 2003 | 48 | 106.9 | 2.3 |
| 2011 | 48 | 106.9 | 2.3 |
| 2011 | 48 | 81.4 | 2.9 |
| 2019 | 45 | 84.8 | 3.0 |
Total possessions per game has steadily come down since 1987, although with a slight increase between 2011 and 2019. The average number of phases per possession has continued to rise in this time, suggesting that the increase in ball-in-play time – over two minutes extra – has allowed for more possessions to take place before the final whistle.
Trading Places — Forwards and Backs
“Forwards win matches, backs decide by how much” is the old adage, but has this become more or less true over the years? To test this theory, we looked at how the role of the forward has evolved by viewing their stats as a proportion of the overall team totals.
Looking at forwards from an offensive perspective, there haven’t been many drastic changes between World Cup editions. One of the gradual changes has been the proportion of carries made, increasing almost every year until a slight drop in 2019. This suggests that in earlier editions of the Rugby World Cup the forwards were more likely to try and get the ball to the pacier backs – a theory that is backed up by the fact that forwards averaged a greater proportion of their team’s passes in earlier tournaments.
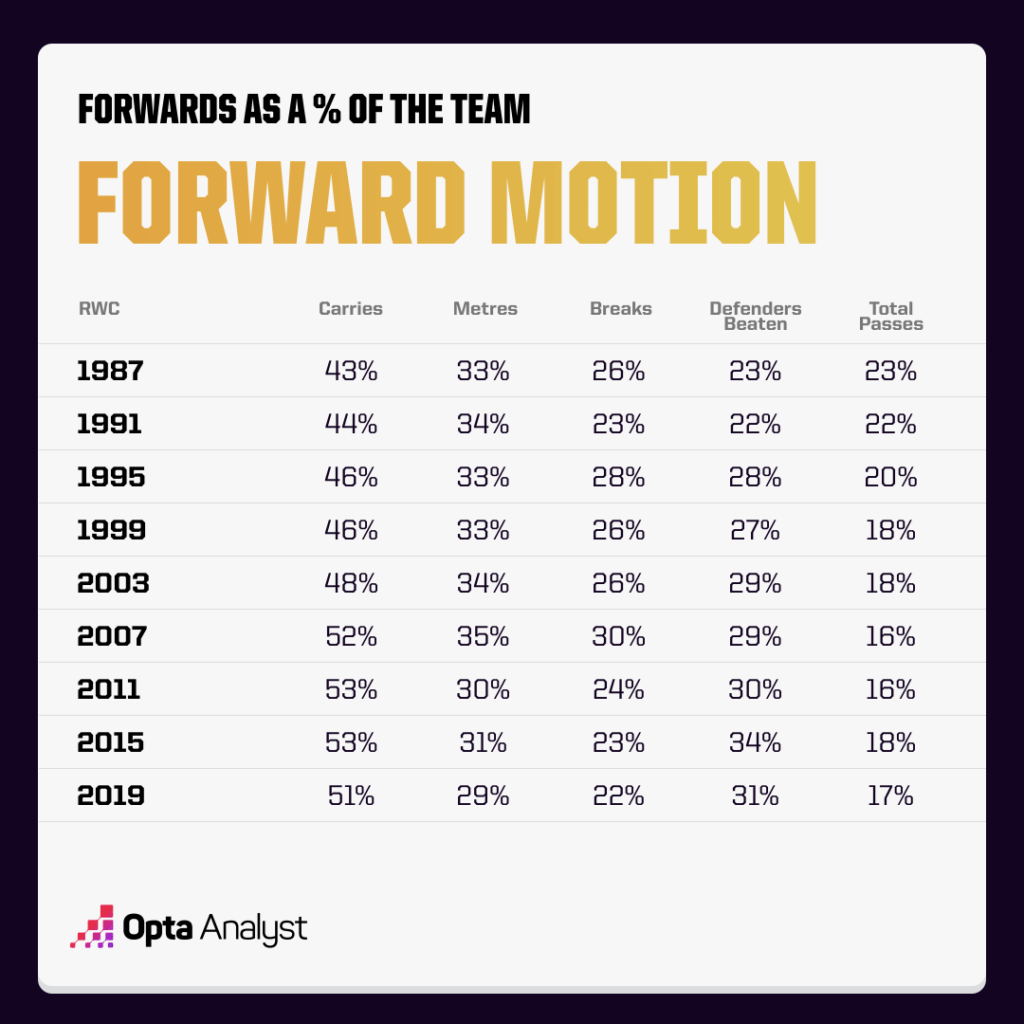
It is interesting to note though that while forwards have made a greater share of the carries in recent years, their metres and clean breaks have fallen. This suggests that members of the forward pack are carrying into contact more often, making it harder to gain metres and make breaks, but could also explain the rise in defenders beaten – with forwards often able to shake off one or two would-be tacklers before going to ground.
Rugby union has changed drastically over the years. The product we see today is of significantly higher quality; the physicality is higher, the fitness is better, it’s faster, there’s more attacking kicking and what’s more, there’s more actions and fewer stoppages than ever before.
Enjoy this? Subscribe to our mailing list to receive exclusive weekly content. And follow us on Twitter too.