
In our first golf explainer, we introduced FRACAS, a proprietary global ranking method for men’s golf. With FRACAS established, we can use the player rates we’ve created to simulate tournaments and detail how the simulations are designed.
Golf has a ridiculous amount of variance.
In fact, the average golfer has a standard deviation of over 11 strokes in a single round. In other words, 65% of an average PGA golfer’s rounds would fall within gaining 5.5 strokes on the field and losing 5.5 strokes to the field, and the remaining 35% of rounds are even more extreme one way or the other.
That’s a wide range of outcomes. Within a single hole, a golfer can have a standard deviation of up to 1.5 strokes. Due to this wide distribution of single hole outcomes, it becomes important to create a robust sample of predictions to encompass as many possible tournament outcomes as we can. Enter simulations.
How are we creating the skeleton for our simulations?
We’ll start with how the golfers are set up. As we discussed when introducing FRACAS, one of the main issues we encounter is the difference in quality of field between tournaments. With individual tournament simulation, we run into a similar issue, but, in this case, it’s quality within a field. Once the entrants to a tournament are loaded into our simulator, we adjust each golfer’s hole scoring averages to the tournament field quality. That sounds complicated, so let’s look at the upcoming Masters tournament for an example.
The Masters field in 2021 is, on average, 0.60 strokes per round better than an average PGA field. Because we’re looking at hole-by-hole information, we want to look at that value per hole, giving us 0.033 strokes per hole better than the average field. Jon Rahm gains 0.215 strokes per par 5 relative to an average PGA field. However, because this field is stronger, that number must be adjusted down to the field. After the adjustment, Rahm is projected to gain just 0.182 strokes per par 5 against the Masters field. This adjustment is important because of our next step.
The second half of our skeleton is the course. Each hole of the upcoming course has a historical scoring average and scoring standard deviation associated with it. To get these values, we simply use past results for this tournament at this course. Most tournaments can swing a hole’s difficulty by multiple strokes just by slight repositioning of the tee box or the pin position.
What we’ve found is that tournament directors are cognizant of this power and will adjust the course setup to the field they are expecting in the upcoming tournament. This makes year-to-year correlations at the same course extremely strong. Getting field-standardized values for individual golfers allows us to use historical information about how a course plays to project how a player in an upcoming tournament will score on each hole, regardless of field strength.
With both player rates relative to field and historical course information, we can start to create the basis for a distribution of how a golfer will play on each hole. Combining the two gets us the framework for a normal distribution for each golfer on each hole.
Now that we have this framework in place, let’s simulate tournaments.
The method we’re using is called random sampling. Each hole for each golfer is simulated 100,000 times, getting us enough samples to create a good distribution. The simulations take the center of the normal distribution, or the predicted average of how the golfer will score on the hole, add or subtract a random number of strokes based on the combined standard deviation of the golfer and the hole, and then round to the nearest whole number because hole scores cannot be decimals.
Again, that’s a lot, so let’s go with an example. Let’s say a player is projected to score an average of 0.334 over par on a hole with a standard deviation of 0.901 strokes. Using this method with 400 simulations, we get the distribution that follows.
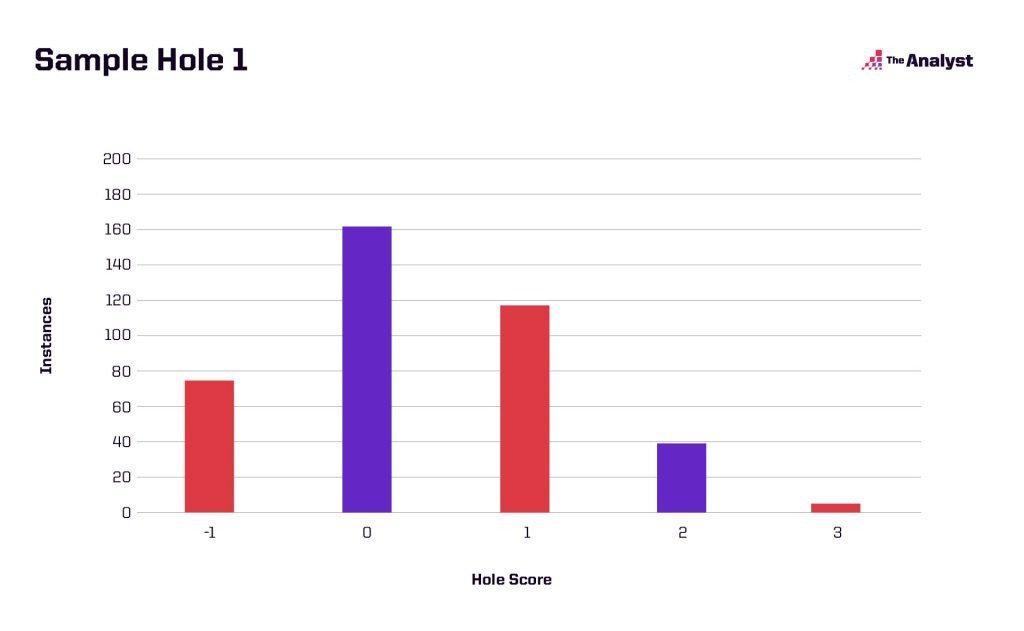
Now let’s say the player is projected to have a lower standard deviation on the hole.
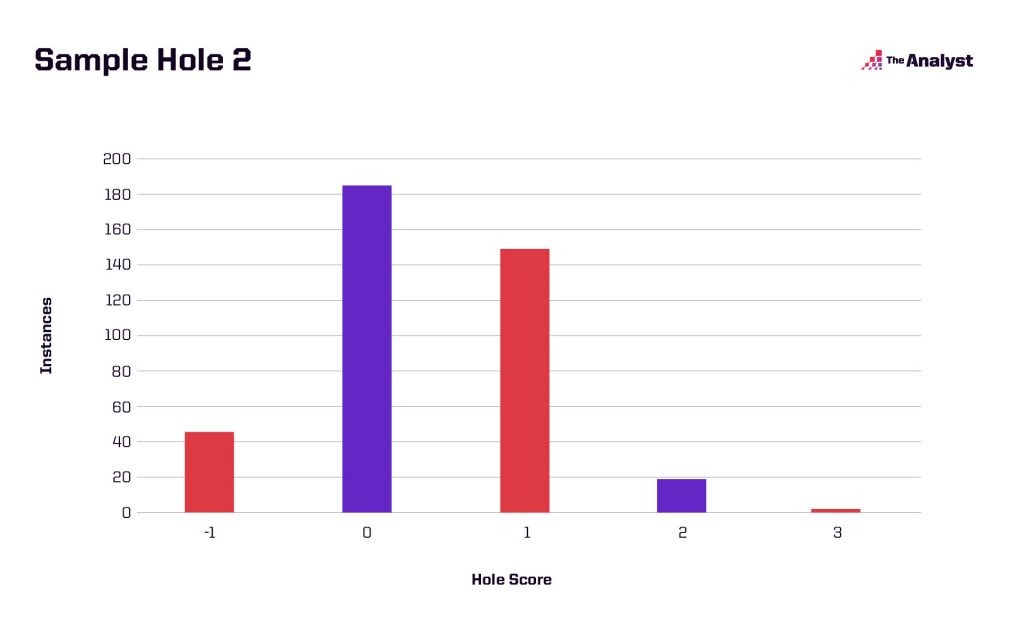
You can start to see differences in the distribution, which is important to recognize when we want to simulate tournaments based on specific golfers and specific courses.
With these 100,000 samples, we can once again use random sampling to create round scores for each golfer. Then, we combine those individual round scores with all of the other golfers to create tournament rounds. We can now simulate multiple rounds of tournaments, remove players who fail to make the cut, and simulate two more rounds for the remaining players to get a distribution of finishing positions.
The importance of individual player information combined with course information and thousands of samples gives us a unique ability to create distributions of outcomes that encompass the player style and course they are playing.
Design by Matt Sisneros.