In an effort to make sense of the crapshoot that is the NBA Draft, we’re using new AutoStats data to dissect some of the recent drafts that should have gone differently.
The NBA Draft brings exciting new players for teams to add and develop, but at the same time, it appears to be somewhat of a crapshoot. And those promising picks often don’t work out as much as teams would like.
A study by Stats Perform in 2020 revealed that nearly a third of 2011-16 first-round picks were out of the league at that time, including 10 of 84 lottery picks. The analysis dug in deep over a 21-year stretch to get a better handle on quantifying the value of individual picks in relation to their draft position using career-long statistics of selections that took place between 1996-2016.
In order to value each player, the study combined their points, rebounds, assists, steals and blocks per game to determine their “score” or total game-by-game contribution. While adding those data points isn’t the most granular way to measure players, it isn’t an unreasonable way of determining their worth either.
Now, 2020-21 MVP Nikola Jokic of the Denver Nuggets has since raised the value of the No. 41 pick and two-time MVP Giannis Antetokounmpo of the Milwaukee Bucks has increased the No. 15 selection over the past year, but you get the idea.
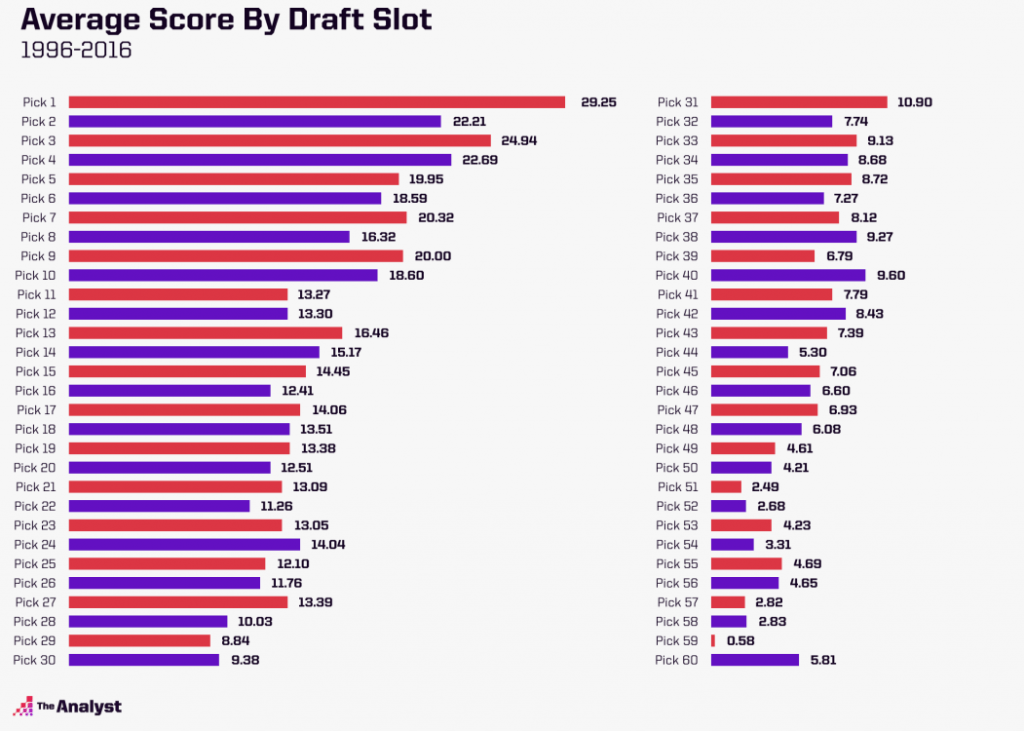
At that time, 52% of the first overall picks from 1996-2016 went on to be what they called “All NBA” players – the best of the best. That’s easily the highest probability of any slot. But it also only produced a star/starter 29% of the time and a role player 14% of the time, meaning the No. 1 pick is very much a boom or bust proposition.
While higher picks typically have better careers than lower picks, the difference between a particular No. 4 and No. 5 selection is minuscule and often comes down to a front office’s preference and team fit. Given this reality, along with the flattening of the lottery odds, teams are pivoting towards simply increasing the sheer number of picks that they control.
The Oklahoma City Thunder have a whopping 34 selections in their war chest over the next seven years, including 17 first-rounders. Even though the Thunder are unlikely to utilize all 34 themselves, their strategy (along with other rebuilding teams such as the Houston Rockets and New Orleans Pelicans) is clear: hoard as many draft picks as possible with the hope that a few of those turn into “All NBA” players.
The boom or bust possibilities of a draft pick have to do with a variety of factors outside of a player’s collegiate play and draft position, but we can use new AutoStats technology to identify collegiate strengths and weaknesses and better understand their subsequent NBA careers.
AutoStats leverages AI-enhanced body recognition technology to identify player position and movement across the entirety of the court. The tool collects comprehensive tracking data from any game through any television broadcast.
Let’s take a look at some previous drafts and use the data to break down important aspects of some of the difficult and critical decisions teams had to make:
2013 NBA Draft
- 1. Anthony Bennett – Cleveland Cavaliers
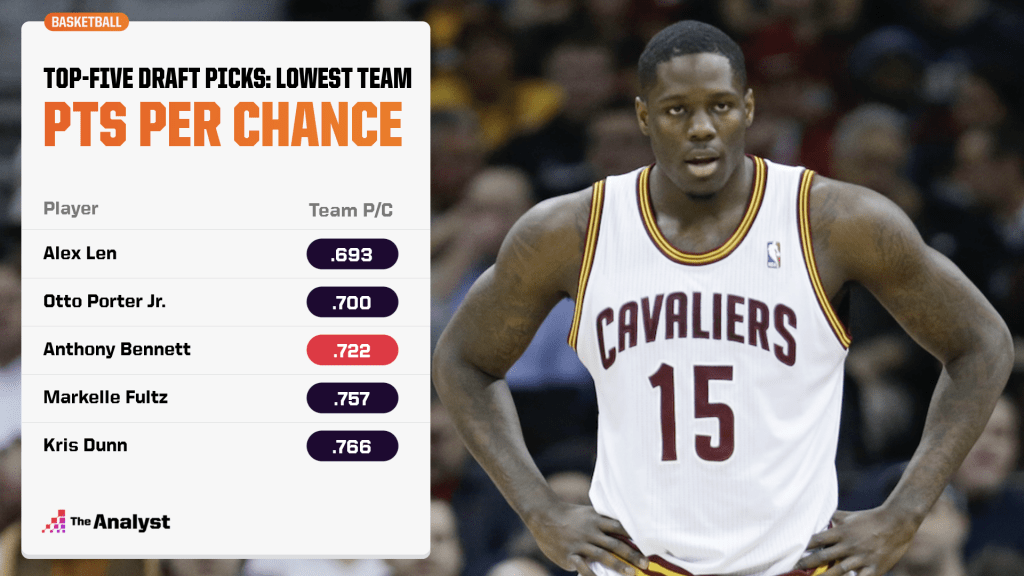
Perhaps one of the most famous busts of all time. Even at that time, many thought that the Cavs had reached to draft Bennett first overall in 2013, but nobody could’ve predicted how poorly Bennett would perform. In his four seasons in the NBA, Bennett never averaged more than 16 minutes a game and ended up with 4.2 points per game for his career.
Bennett’s team averaged .722 offensive points per chance when he was on the floor. Of players drafted in the top five in the past eight years, Bennett’s points per chance is the third worst – behind only Alex Len and Otto Porter Jr. Other No. 1 picks in the past eight years averaged .801 points per chance, a whopping .08 points per chance ahead of Bennett.
2016 NBA Draft
- 5. Kris Dunn, Minnesota Timberwolves
- 6. Buddy Hield, New Orleans Pelicans
- 7. Jamal Murray, Denver Nuggets
This three-pick sequence in the 2016 draft is particularly interesting because of the similarity of the situations of these three teams. In the three seasons before this draft, they had a combined one playoff appearance (the Pelicans were the eighth seed in 2015) and were all in need of a guard. While Dunn was considered the best of the group at the time of the draft, his career path has fallen short of Hield’s and Murray’s.
According to the AutoStats data, we probably shouldn’t be surprised. Dunn’s No. 1 strength was always his defense – and that remains the case – but questions percolated about his decision-making and shooting range. Many saw him as an elite shot creator and pick-and-roll operator.
However, on possessions in which Dunn ran a pick-and-roll in his final season at Providence, his team averaged .77 points per chance – only marginally better than Murray’s .76 team points per chance and significantly worse than the 1.02 team points per chance that Hield averaged.
Furthermore, Providence only scored .70 points per chance when that possession featured a Dunn isolation and only 6% of Dunn’s drives were to his left hand, indicating that would be a weakness for him in the NBA. Meanwhile, 20% of Hield’s drives were to his left (right at the average across college basketball) and Oklahoma averaged .90 points per chance when that possession featured a Hield isolation.
Murray’s drives were even more balanced with a 35% left drive percentage to go along with .75 team points per chance when Murray isolated. Despite struggling as a shooter in his first few years in college, many evaluators thought Dunn’s uptick in 3-point field goal attempts and efficiency in his final year at Providence suggested he would grow into at least an average 3-point shooter in the NBA. The AutoStats data did not regard him as a very good shooter, especially compared to Hield and Murray, and that’s proven to be the case. Dunn has a career 3-point percentage of 30.5 in the NBA, while Murray is at 36.7% after shooting at a career-high 40.8 clip last season and Hield is at 40.6% from 3.
Hield had a classic four-year college career, getting a little bit better every year before breaking out as a senior at Oklahoma. Hield was a stellar shooter coming out of college but lacked the explosiveness that Dunn and Murray had. AutoStats ranked Hield as the worst defender of the three (giving up .742 points per chance compared to .696 for Murray and .721 for Dunn), but also the most prolific shooter. The most impressive thing about Hield’s college career was his evolution as an off-the-dribble shooter. He ended his senior season in Norman with a 41.7% off-the-dribble 3-point percentage – a skill that has translated well to the NBA (Hield shot 38.4% on off-the-dribble 3s this past season).
Of the three back-to-back-to-back picks, Murray has been the biggest revelation in the NBA. Despite only playing a single season at Kentucky, Murray finished with .824 points/chance, giving him a slight edge over Hield’s .816 and significantly ahead of Dunn’s .766. He also shot 42.4% from NBA 3-point range in college and while he hasn’t shot quite that well, he made tremendous strides in 2020-21.
If there were a redraft today, the order would likely go Murray, Hield and Dunn. Murray’s age (three years younger than Dunn and Hield) and potential development should have been a large contributing factor.
2017 NBA Draft
- 2. Lonzo Ball, Los Angeles Lakers
- 5. De’Aaron Fox, Sacramento Kings
- 9. Dennis Smith Jr., Dallas Mavericks
These three guards drafted in the top 10 of the 2017 draft have had very different NBA careers and the chart below helps tell the story of their college careers and how their skill sets fit into the league.
| Player | Pts/Chance | Drive Team Pts/Chance | Direct Drive% | Pts/Iso | Iso Team Pts/Chance | PnR Ball-Handler Team Pts/Chance |
|---|---|---|---|---|---|---|
| Lonzo Ball | .921 | .970 | .596 | .311 | 1.017 | 1.031 |
| De’Aaron Fox | .851 | .876 | .772 | .417 | .886 | .968 |
| Dennis Smith Jr. | .804 | .777 | .668 | .277 | .738 | .763 |
Right away, we can see that Smith lagged behind Ball and Fox in every category. Smith’s offensive points/chance ranked an almost .05 points/chance behind Fox and .12 points/chance behind Ball. In possessions in which the player makes a drive, Smith ranked third among the group in team points/chance with an even bigger gap between him and Fox and Ball.
Smith was consistently regarded as one of the most explosive players in the draft, but his direct-drive percentage is significantly below Fox’s. Both players’ direct-drive percentages were higher than Ball’s, who lagged 7% behind Smith and nearly 18% behind Fox.
In isolation situations, Ball thrived with 1.017 team points/chance despite only having .311 player points per chance. This means that many of Ball’s isolations led to the defense collapsing and him kicking the ball out or dumping it off, generating lots of assists – and points for his team. Meanwhile, Fox generated the most player points per isolation of the three while also generating a healthy .886 team points per chance coming out of his isolations. Smith trailed behind the two significantly in both player and team points per isolation chance.
Finally, we can see the differences in each player’s ability to run the pick-and-roll as a ball handler. Ball was slightly better in this category than Fox and both players were significantly better than Smith. These two stats are particularly important considering the number of pick-and-rolls and isolations run in the NBA.
The ability to shoot, especially from deep, has also grown increasingly more important in the league. AutoStats didn’t regard Fox as a very good shooter coming out of college, identifying that he shot just 22% from NBA 3-point range in college. Fox did improve his 3-point percentage every month while at Kentucky, giving evaluators some room for optimism regarding his shooting.
Smith shot slightly better than Fox, shooting 30% from NBA 3-point range while Ball paced the group at 46% from that range. While each player has improved as a shooter over the course of his NBA career, the data clearly regarded Ball as the best shooter of the group and that’s held true so far. Ball is a 35.3% shooter from 3 in the NBA after making them at a career-best 37.8 clip this past season, while Fox is at 32.6% and Smith is at 31.6%.
So it could be argued that Fox might have been the pick for a team looking for more of a slasher/scorer and Ball for a club seeking a distributor and slightly better 3-point shooter, but what the data more aptly reveals is how much Smith was a questionable choice at No. 9.
Player evaluation is difficult in real-time, and we have the advantage of looking back on previous results. Of course, in the crapshoot that is the NBA Draft, the numbers should not be used to evaluate players and predict their NBA careers by themselves.
But in these cases above, the data certainly helps explain in better context the course of these players’ pro paths.
Taylor Bechtold and Parker Kaplan contributed. Design by Matt Sisneros.