
Welcome to The Data Day, our daily NBA Finals blog where we try to make sense of what just happened, examine the key players and matchups, and identify any potential adjustments as the series progresses.
The Phoenix Suns boldly chose to double down on an 8-0 finish at Orlando’s Walt Disney World Resort in July and August, acquiring then 10-time All-Star Chris Paul from the Oklahoma City Thunder for four players and a 2022 first-round pick.
It was a risky move given that then 35-year-old Paul had a sizable contract (two years remaining at $80-plus million total). Almost eight months later, the addition has paid tremendous dividends as the 16-year veteran has helped lead Phoenix to its first NBA Finals appearance since 1993.
And really, the massive turnaround is something we all should’ve seen coming.
In the 10 seasons since being traded to the Los Angeles Clippers before the 2011-2012 campaign, Paul has a .695 regular-season winning percentage – good for 11th over that span (minimum 225 games played). The 10 players ahead of him all played at least three seasons for the Golden State Warriors’ dynasty or the early 2010’s San Antonio Spurs. Paul even ranks one spot ahead of all-time great LeBron James (who has a .693 regular-season winning percentage over that span).
In that same time span, Paul has the second-highest raw plus/minus behind only Stephen Curry. Despite playing almost 3,000 fewer minutes over that span than LeBron, CP3’s raw plus/minus is 407 higher. But CP3 doesn’t just join winning teams, he elevates them. Consider this: Paul has joined a new team four times in the past 10 years, and each of those clubs has increased its winning percentage the very next season.
Despite being in the twilight of his Hall of Fame career, Paul seems to be rejuvenated every time he faces a new challenge. After averaging 15.9 points in his final season in New Orleans in 2010-11, he put up 19.8 in his debut campaign with the Los Angeles Clippers the following year. CP3 also had 18.6 points per game with the Rockets in 2017-18, after finishing with 18.1 the previous season with the Clippers.
And after averaging 15.6 points in his final season with the Rockets, Paul had a somewhat surprising rebirth with 17.6 points, 6.7 assists and 5.0 rebounds for the Thunder. His 48.9 field-goal percentage in 2019-20 was his highest since shooting 49.3% in 2009-10.
That 2009-10 season was also the last time the Suns reached the playoffs, but looking at the adjusted team ratings chart below, there was evidence to suggest that drought would come to an end. Adjusted team ratings are calculated using a model that takes advanced metrics on both sides of the ball and formulates how many points per 100 possessions better or worse a team was than the average club during those specific seasons, including the playoffs.
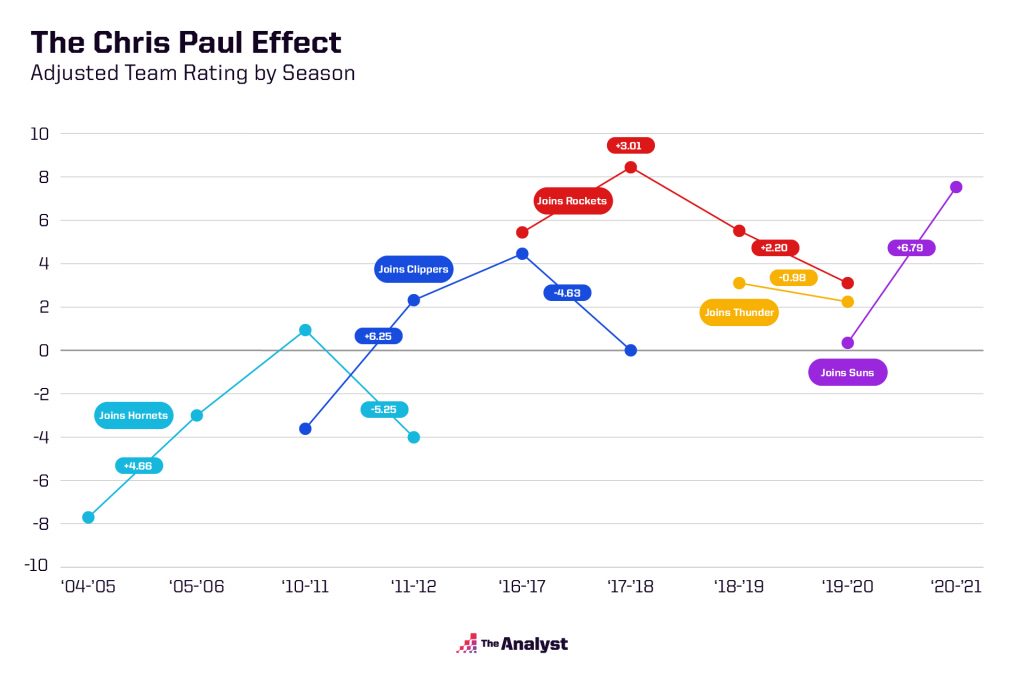
We can see that CP3 has not only had an immediate impact on his new teams, but that those clubs also take a major step backward once he moves on. In 2004-05, the New Orleans Hornets finished 18-64 before taking Paul fourth overall in the NBA draft.
They would go on to win 38 games as Paul won the NBA Rookie of the Year Award in the following season. He led them to three playoff appearances in four years between the 2007-08 and 2010-11 seasons before getting traded to the Clippers.
Los Angeles finished 32-50 in 2010-11 before acquiring CP3, but the Clips went 40-26 during the shortened 2011-12 campaign and reached the playoffs in six straight seasons for the first time in franchise history with Paul as their floor general. The Rockets were already a good team, finishing 55-27 in 2016-17 before acquiring Paul for quite the package: Sam Dekker, Patrick Beverley, Lou Williams, DeAndre Liggins, Darrun Hilliard, Montrezl Harrell, Kyle Wiltjer, a top-three projected 2018 first-round pick and $661,000.
But the Rockets took a big leap forward with Paul, winning a franchise-record 65 games and taking a 3-2 series lead on the Warriors in the West finals before Paul went down with a leg injury late in Game 5. Without CP3 in 2019-20, the Rockets finished with a .611 winning percentage (44-28) – their lowest since going 41-41 in 2015-16.
While the Oklahoma City numbers aren’t impressive on the surface, remember that not much was expected of the Thunder in 2019-20 after Russell Westbrook was moved to the Rockets (for Paul) and Paul George was traded to the Clippers. In fact, ESPN forecasted that OKC would finish 13th in the 15-team West with a 33-49 record.
With Paul on board, the Thunder earned the fifth seed in the West at 44-28 and took Westbrook, Harden and the Rockets to seven games while CP3 averaged team highs with 21.3 points and 5.3 assists and was second with 7.4 rebounds.
Chris Paul with Top Teammates
| Seasons | Team | Lineup | Off Rating | Def Rating | Net Rating |
|---|---|---|---|---|---|
| 03/04-04/05 | Hornets | David West before Paul | 98.0 | 109.6 | -11.6 |
| 05/06-10/11 | Hornets | David West w/o Paul | 108.9 | 113.4 | -4.5 |
| 05/06-10/11 | Hornets | David West w/Paul | 114.4 | 111.2 | 3.2 |
| 10/11 | Clippers | Blake Griffin before Paul | 111.6 | 114.4 | -2.8 |
| 11/12-16/17 | Clippers | Blake Griffin w/o Paul | 112.7 | 113.3 | -0.6 |
| 1112-16/17 | Clippers | Blake Griffin w/Paul | 121.8 | 108.9 | 12.9 |
| 17/18 | Clippers | Blake Griffin after Paul | 114.4 | 113.9 | 0.6 |
| 12/13-16/17 | Rockets | James Harden before Paul | 117.0 | 111.9 | 5.1 |
| 17/18-18/19 | Rockets | James Harden w/o Paul | 121.3 | 113.4 | 7.9 |
| 17/18-18/19 | Rockets | James Harden w/Paul | 123.7 | 113.9 | 9.7 |
| 19/20 | Rockets | James Harden after Paul | 118.4 | 113.0 | 5.4 |
| 15/16-19/20 | Suns | Devin Booker before Paul | 111.9 | 120.8 | -8.8 |
| 20/21 | Suns | Devin Booker w/o Paul | 124.6 | 120.0 | 4.6 |
| 20/21 | Suns | Devin Booker w/Paul | 123.6 | 116.5 | 7.1 |
The chart above shows how each of Paul’s top teammates has made a larger impact on his respective clubs with CP3 as opposed to before his arrival; while he was on the team but not on the floor; and after he moved on to another franchise.
David West’s scoring average went from 6.2 points in 2004-05 to 17.1 in Paul’s rookie year and he averaged 19.2 points in his six seasons with CP3. After they split ahead of the 2011-12 season, West averaged just 12.8 points with the Indiana Pacers and didn’t put up more than 18 per game in any season after that.
Blake Griffin’s ratings with Paul compared to without him aren’t even close, and it was with CP3 that James Harden won the 2017-18 MVP. Harden’s scoring average increased from 29.1 points to league highs of 30.4 and 36.1 in his two seasons with CP3 before going down to 34.3 (albeit also a league high) in the 2019-2020 season without him.
And while Devin Booker has seen a slight decrease in scoring since Paul’s arrival in Phoenix, his net rating has skyrocketed.
Chris Paul with Centers
| Season | Team | Lineup | Off Rating | Def Rating | Net Rating |
|---|---|---|---|---|---|
| 06/07-08/09 | Hornets | Tyson Chandler w/o Paul | 105.5 | 105.7 | -0.2 |
| 06/07-08/09 | Hornets | Tyson Chandler w/Paul | 116.7 | 111.0 | 5.7 |
| 08/09-10/11 | Clippers | DeAndre Jordan before Paul | 109.1 | 116.5 | -7.4 |
| 11/12-16/17 | Clippers | DeAndre Jordan w/o Paul | 112.3 | 113.4 | -1.1 |
| 1112-16/17 | Clippers | DeAndre Jordan w/Paul | 121.2 | 108.2 | 13.0 |
| 17/18 | Clippers | DeAndre Jordan after Paul | 113.9 | 115.4 | -1.5 |
| 14/15-16/17 | Rockets | Clint Capela before Paul | 117.1 | 111.0 | 6.1 |
| 17/18-18/19 | Rockets | Clint Capela w/o Paul | 120.3 | 112.6 | 7.8 |
| 17/18-18/19 | Rockets | Clint Capela w/Paul | 119.9 | 112.1 | 7.9 |
| 19/20 | Rockets | Clint Capela after Paul | 114.8 | 112.4 | 2.4 |
| 18/19 | Thunder | Nerlens Noel before Paul | 108.1 | 109.7 | -1.6 |
| 19/20 | Thunder | Nerlens Noel w/o Paul | 106.6 | 109.1 | -2.5 |
| 19/20 | Thunder | Nerlens Noel w/Paul | 117.7 | 113.7 | 4.0 |
| 13/14-18/19 | Thunder | Steven Adams before Paul | 115.7 | 109.9 | 5.9 |
| 19/20 | Thunder | Steven Adams w/o Paul | 108.3 | 109.9 | -1.6 |
| 19/20 | Thunder | Steven Adams w/Paul | 122.9 | 114.7 | 8.2 |
| 18/19-19/20 | Suns | Deandre Ayton before Paul | 112.1 | 116.7 | -4.7 |
| 20/21 | Suns | Deandre Ayton w/o Paul | 122.1 | 124.7 | -2.7 |
| 20/21 | Suns | Deandre Ayton w/Paul | 122.0 | 114.7 | 7.3 |
One area that Paul has really excelled in has been getting the most out of big men. Though former No. 1 pick Deandre Ayton has had a dig in points per game since the addition of Paul, his efficiency has gone through the roof with an effective field goal percentage (eFG) of .629 this season up from .548 last season. Ayton’s net rating has also considerably jumped this season, especially with Paul on the court. Ayton will be the first to acknowledge Paul’s impact on him this season, but he isn’t the only center who CP3 has elevated.
Tyson Chandler went from a defensive specialist to half of a dynamic pick-and-roll lob duo with Paul in New Orleans/Oklahoma City. Then Los Angeles became known as “Lob City” after CP3 arrived because of his constant highlight-reel alley-oop passes to Griffin and DeAndre Jordan during the most successful stretch in franchise history.
Clint Capela became the benefactor in Houston, where he averaged career highs of 13.9 points in 2017-18 and 16.6 in 2018-19 while playing alongside Paul, before his scoring average dipped back to 13.9 without him in 2019-20. Even Steven Adams, who is not a go-up-and-get-it type and played six seasons with either Westbrook/Kevin Durant, Westbrook/Oladipo or Westbrook/George, had a tremendous increase in his net rating while with CP3 last season.
Playoff CP3
The one knock against Paul has been a lack of playoff success, but he shouldn’t bear too much of the blame for those playoff losses.
For one, CP3 has had terrible injury luck, none more forgettable than the previously mentioned hamstring strain against the Warriors in the West finals. But when Paul is in the lineup, his production has been consistent with that of the regular season. The table below shows Paul’s career regular season and playoff stats.
While he averages about an assist less in the playoffs, CP3 increases his scoring average by 2.3 points while maintaining a similar efficiency to that of the regular season. Paul’s 41-point, 8-assist, 0-turnover Game 6 clincher in this year’s West finals shows how he can still deliver in big games.
| Career Stats | FG% | 3P% | FT% | RPG | APG | SPG | BPG | TPG | PPG |
|---|---|---|---|---|---|---|---|---|---|
| Regular Season | 0.472 | 0.371 | 0.873 | 4.5 | 9.4 | 2.1 | 0.1 | 2.4 | 18.3 |
| Playoffs | 0.477 | 0.368 | 0.852 | 5.1 | 8.3 | 2.0 | 0.2 | 2.6 | 20.6 |
Regardless of what happens in the Finals against the Milwaukee Bucks, CP3’s impact on the Suns has been nothing short of impressive – though given his history of elevating teams, it really shouldn’t be much of a surprise.
Keep coming back to our daily NBA Finals blog, The Data Day, where we try to make sense of what just happened, examine the key players and matchups, and identify any potential adjustments as the series progresses.
Design by Matt Sisneros. Data modeling by Matt Scott.