In this installment of a series on advanced football metrics, we examine how burn and open percentages measure the impact of pass catchers and their defenders by removing the passer from the equation.
It’s easy to look at a box score and see which receiver caught the most passes or gained the most yards. But is that a reliable way to determine how well a receiver played when so much of his success depends on the player throwing him the ball?
There’s a big difference between being fed by Tom Brady and Blake Bortles, so it stands to reason that the best way to evaluate receivers is to remove the passer from the equation as much as possible.
The same problem exists for defenders. Statistics like completion percentage or QB rating when targeted might seem valuable, but consider this: An incomplete pass into perfect coverage and an overthrow on a receiver that should have been an 80-yard touchdown produces the same value in those stats.
Faced with this problem, metrics have been developed that analyze the receiver-defender relationship by removing quarterback play as much as possible.
One of these metrics is a burn, which occurs when the targeted receiver does his part to achieve a successful play (that is, a significant gain towards a first down or touchdown), regardless of the quality of the throw by the quarterback.
A receiver doesn’t even have to catch a pass to be credited with a burn. If he gets open beyond the first-down marker but the QB doesn’t deliver a catchable ball, the receiver still gets credit for doing his part in making the play successful. Likewise, the defending player in coverage is credited with a burn allowed.
Conversely, if a receiver makes a catch for a 7-yard gain on third-and-10, no burn is credited because he wasn’t able to earn his team a new set of downs. Each target is also credited with burn yardage that represents how many yards were gained on a reception. He’s also credited with burn yardage if he was open but the pass wasn’t completed.
As an example, let’s take a look at who led the NFL in burn percentage (Burn%) in 2020:
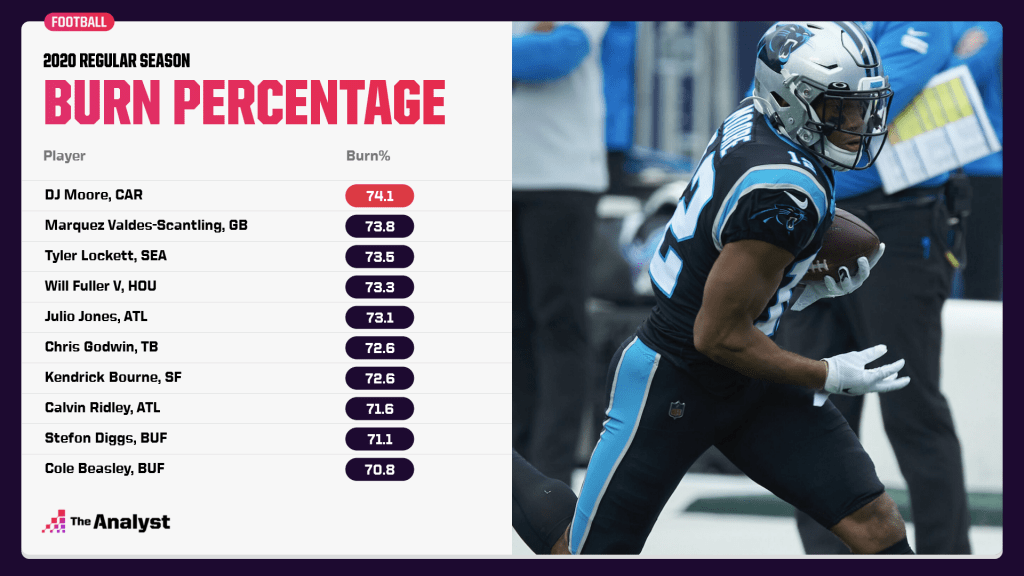
DJ Moore of the Carolina Panthers, who finished 11th in the league with 1,193 receiving yards, topped all receivers with a Burn% of 74.1 — well ahead of the 62.5 league average.
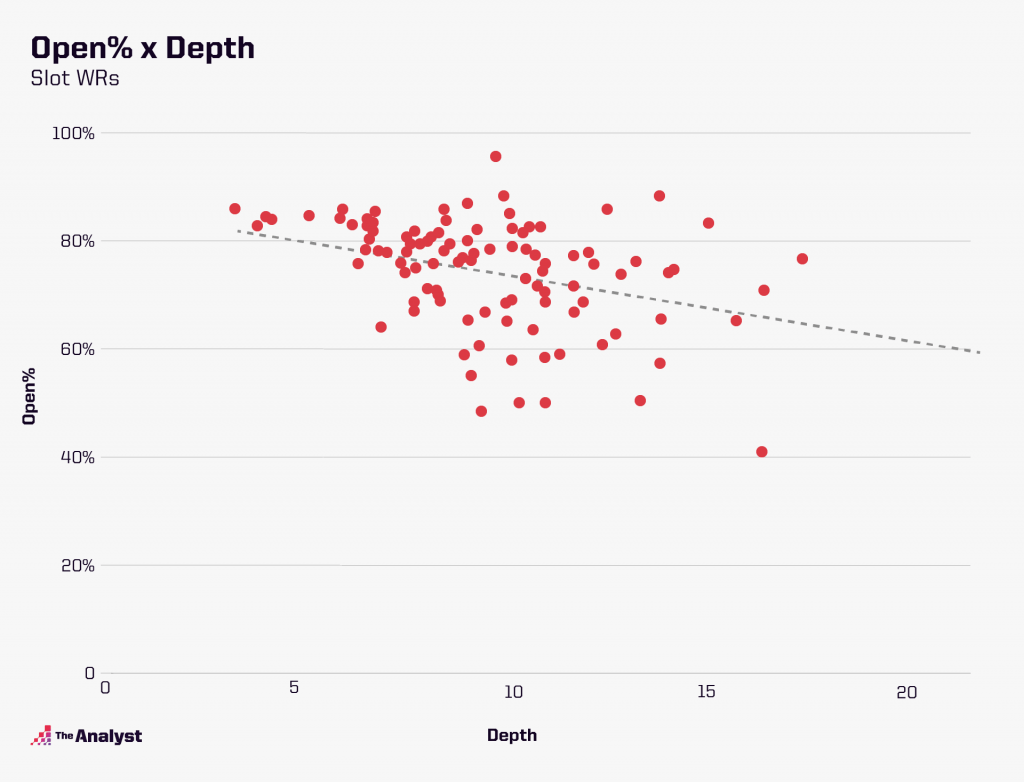
Open percentage (Open%) is simply how often a receiver is open when he is targeted. Open% has an indirect correlation with average target depth — that is, how far downfield a receiver is targeted. This makes sense because it is generally easier to get open on short, quick routes as opposed to longer downfield passes that have less margin for error.
As shown below, Open% is also affected by where a receiver lines up.

Receivers in the slot are more likely to get open for two reasons:
- They require a shorter throw because they are closer to the middle of the field.
- Their defenders need to cover routes in either direction, whereas outside cornerbacks are able to use the sideline as an extra defender.
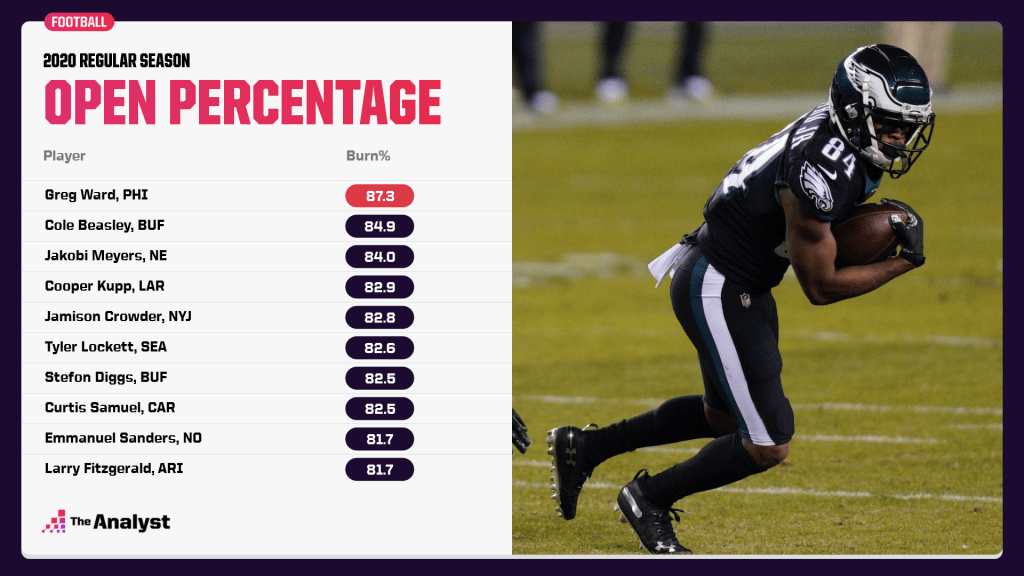
It’s no accident that Greg Ward led the Eagles with 53 receptions and six touchdowns in 2020. The second-year wideout also paced all receivers with at least 60 targets with an Open% of 87.3 — far above the NFL average of 73.7.
One might think being open more would translate to a higher Burn%, but that isn’t the case. Because routes from the slot are much more likely to be short of the sticks (52% of the time, as opposed to 42% of the time for outside WRs), Slot receivers will be open without recording a burn on more occasions. That’s also seen in the 1.5-yard difference between outside receivers and slot WRs in burn yards per target.
Defensive backs have lower numbers across the board than wide receivers. The biggest reason for this is the amount of zone coverage played in the NFL. Underneath or in-breaking routes are often the responsibility of linebackers dropping into coverage; so cornerbacks, both inside and outside, are less likely to get burned.
Again, let’s use 2020 as an example and look at the players who were the league’s best at burn-allowed percentage:
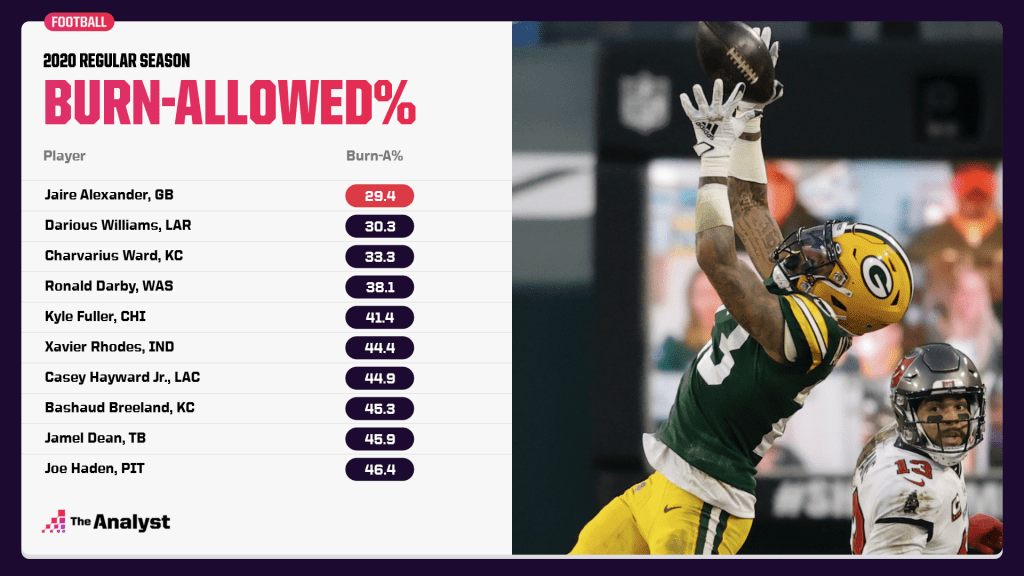
Jaire Alexander of the Green Bay Packers starred in these metrics in 2020, leading the NFL in both burn-allowed (29.4) and open-allowed percentage (41.7).
Darious Williams of the Los Angeles Rams was second in the league in burn-allowed percentage at 30.3 (NFL average: 53.2) and third (see below) with a 50.0 open-allowed percentage (league average 65.7).
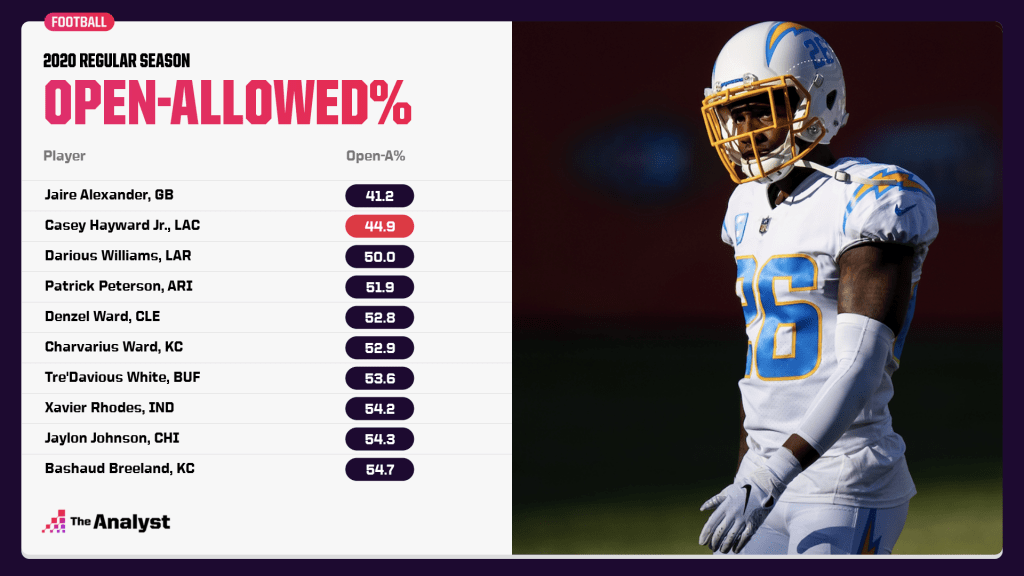
Los Angeles Chargers cornerback Casey Hayward Jr., who was seventh in burn-allowed percentage, ranked behind only Alexander with an open-allowed percentage of 44.9.
Find the current leaders in these metric here.
Design by Matt Sisneros.