Passing ability is one of the most important traits to quantify from a performance analysis and recruitment perspective, yet the most commonly used metric, pass completion percentage, is heavily biased by a player’s role more than their ability. For example, a centre back attempting mostly short, sideways passes will usually have a higher pass completion percentage than a winger attempting crosses into the opposition box – but is this enough to say that the centre back is the better passer?
Stats Perform’s Expected Pass Completion (xP) framework addresses this issue by considering information about an attempted pass to establish the probability it is completed. In this article we demonstrate how individual xP values reflect pass risk and how aggregating xP values across a game or season show a player or team’s pass difficulty selection. We also introduce a derived metric, Passes Completed Above Expected (PAx), which evaluates player passing skill – how good a player is at completing the passes they attempt given their difficultly.
Expected Pass Completion (xP)
Just as expected goals (xG) predicts the likelihood of a shot being scored, our xP framework models the probability of a pass being completed by taking information about the pass and the current possession.
Firstly, we take basic geometric information about the pass:
- x-coordinate of pass start location
- mirrored y-coordinate of pass start location (e.g. so a pass played from the left edge of the penalty area and a pass played from the right edge of the penalty area would both take the value 20.1)
- angle of pass based on end location
- approximate distance of pass based on end location
Secondly, we take contextual information about the pass, including:
- was it played with the feet or the head?
- was it a cross?
- was it in open play or a set piece?
- was it a ground pass or airborne?
Finally, we utilise contextual information about the events leading up to the pass, such as:
- how many passes were in the possession so far?
- how far was the ball carried by the player beforehand?
- how fast has the ball moved vertically up the pitch in the previous three actions?
- was the previous action by a teammate or an opponent?
- what kind of event was the previous action (e.g. pass, set piece, defensive action, take-on, header)?
- what was the distance and angle of the previous pass (if the previous action was a pass)?
Using these features, we train a model to predict the likelihood of a pass being completed or not based on its observed outcome (where 0 = incomplete, 1 = complete). In this way, 0.2 xP represents a high-risk pass (i.e. one predicted to be completed only 1 in 5 times) and 0.8 xP represents a relatively low-risk pass (i.e. predicted to be completed 4 in 5 times).
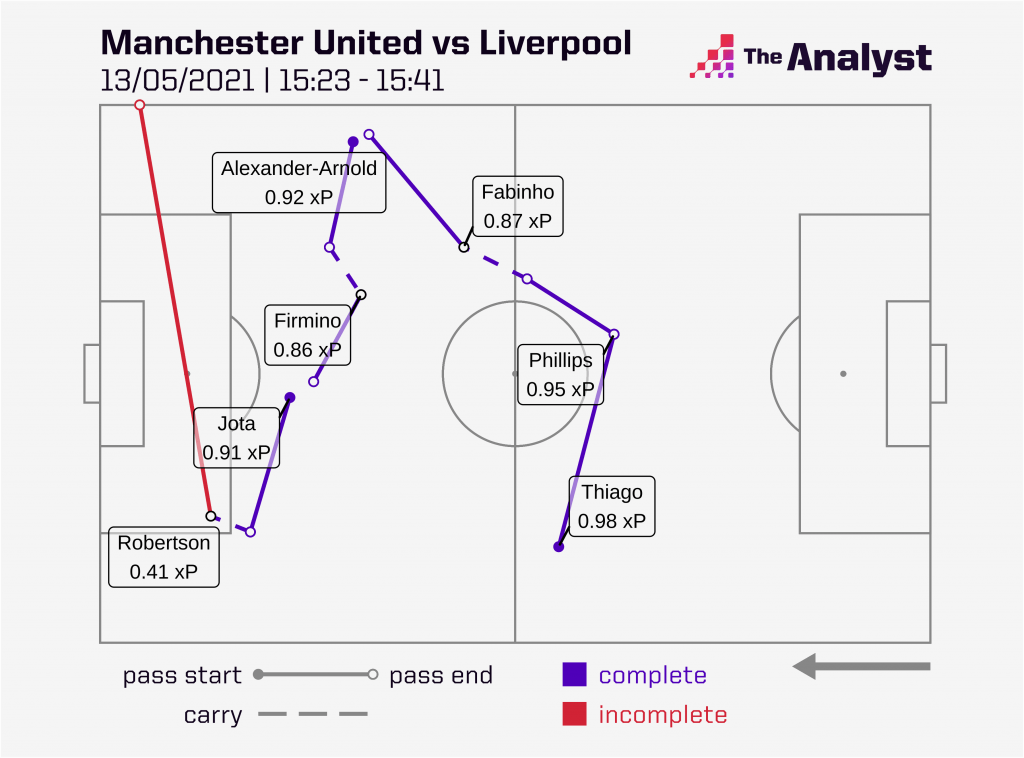
We can visualise xP values for each individual pass in an example sequence below from Liverpool vs. Manchester United last season. A free kick taken by Thiago marks the start of a possession of relatively easy passes (all above 0.85 xP), which moves up the pitch towards the right wing before switching flanks via three quick passes and finally ending after a more difficult cross by Andrew Robertson (0.41 xP) goes unsuccessfully out of play (we show an example of quantitative explanations for two of these predictions in the Appendix at the end of the article).
Aggregating xP per Season
As with xG, we may be less interested in analysing the values of individual actions using this metric – small sample sizes are noisy and not necessarily representative of a player’s true performance – and instead prefer to aggregate xP at different levels: average per player per game, average per team per season, and so on.
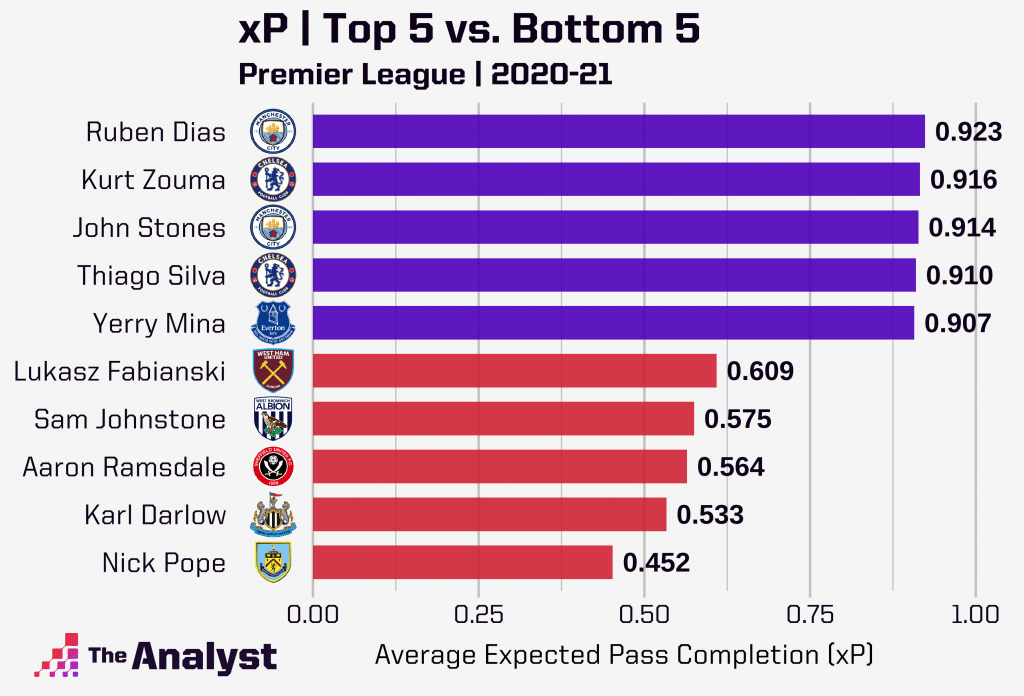
If we take the mean xP per pass of all players with 2,000 minutes played in the Premier League in 2020-21, we see Ruben Dias attempts the lowest risk passes (0.92 xP) whilst Nick Pope attempts the highest risk passes (0.45 xP). These values can help quantify the different roles these players fulfil; for instance, Dias mainly plays safe passes in a very high Manchester City back line where losing possession could be catastrophic, whereas Pope often plays direct, long balls upfield for Burnley to contest with aerial duels.
Passes Completed Above Expected (PAx)
xP only tell us the average difficulty of attempted passes but not necessarily how skilled a player is at completing them. By subtracting the predicted pass outcome (xP) from the observed pass outcome (where 0 = incomplete, 1 = complete), we can estimate how much better or worse than expected a player is at completing the passes they attempt. We call this measure PAx, which can also be thought of as ‘passes completed above expected’.
For example, a difficult pass (0.2 xP) which is completed (outcome = 1) is scored:
[Outcome – xP = PAx]
1 – 0.2 = 0.8 PAx
Whilst an easy pass (0.8 xP) which is not completed (outcome = 0) receives a negative score of:
0 – 0.8 = -0.8 PAx
We can easily sum this score per team or per player across a game or a season. For example, if Player A attempts 1000 passes in a season with a total of 750 xP and completes 800 of them, they receive a score of:
800 – 750 = 50 PAx
However, if another player, Player B, attempts 2000 passes with a total of 1750 xP and completes 1800 of them, they receive the same total score as Player A (1800 – 1750 = 50 PAx) despite playing 1000 more passes.
We can make this metric fairer by normalising it and instead calculating PAx per pass. Now, Player A has a normalised PAx score of:
(800 – 750) / 1000 = 0.050 PAx per pass
Whilst player B has:
(1800 – 1750) / 2000 = 0.025 PAx per pass
Normalising like this usually yields a low magnitude value, so we may better express the metric per 100 passes, i.e. Player A has 5 PAx per 100 passes – in other words, they complete 5 more passes per 100 than expected.
Aggregating PAx per Season
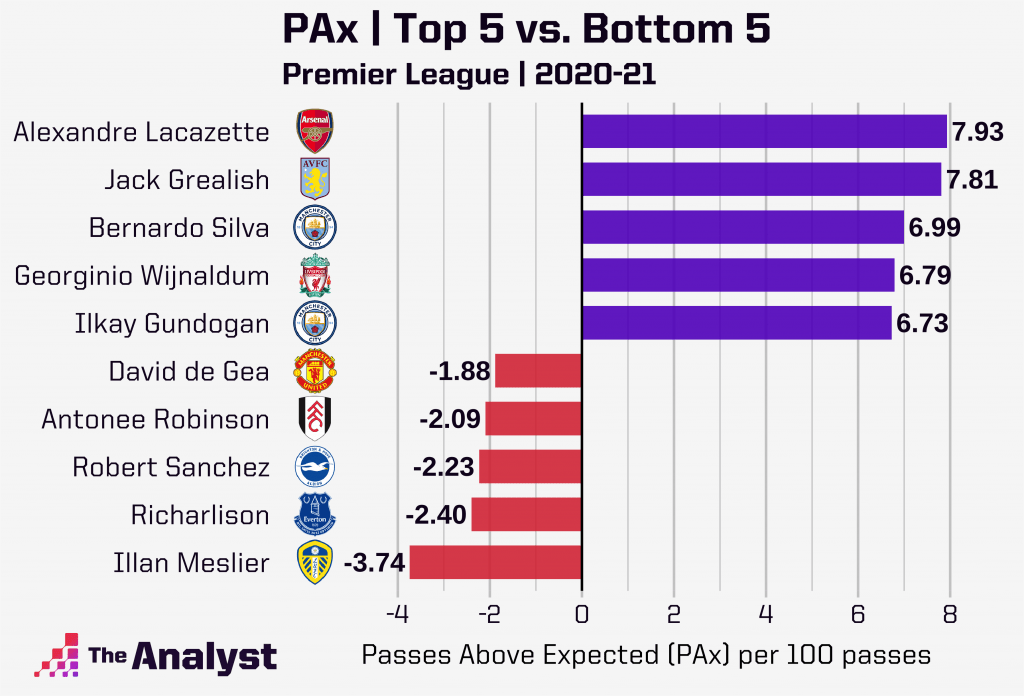
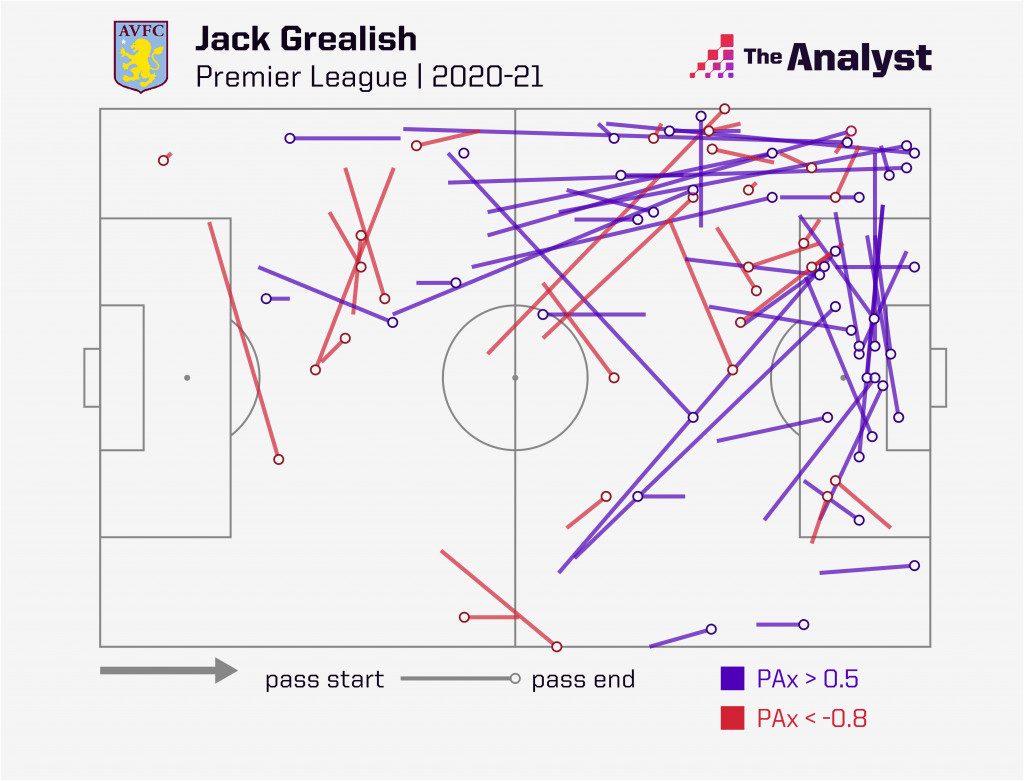
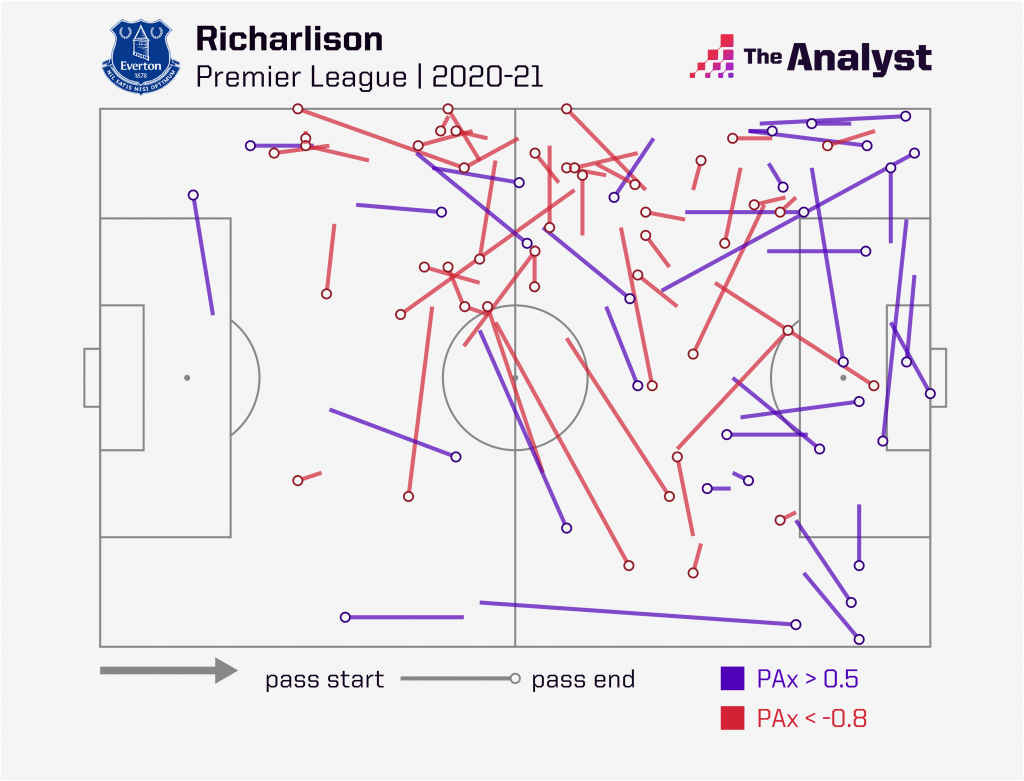
Looking again at Premier League players with 2000+ minutes in 2020-21, Jack Grealish had one of the highest normalised PAx scores (7.8 PAx per 100 passes) whilst Richarlison had one of the lowest scores (-2.4 PAx per 100 passes). In other words, for every 100 passes that Jack Grealish made last season, he completed almost eight more than the average player would be expected to, whilst Richarlison completed almost two fewer than expected.
We can visualise this difference by comparing individual passes of interest between these two players below, where only high-skill passes above 0.5 PAx (i.e. difficult passes below 0.5 xP which are completed) are shown in blue and low-skill passes below -0.8 PAx (i.e. easy passes above 0.8 xP which are not completed) are shown in red.
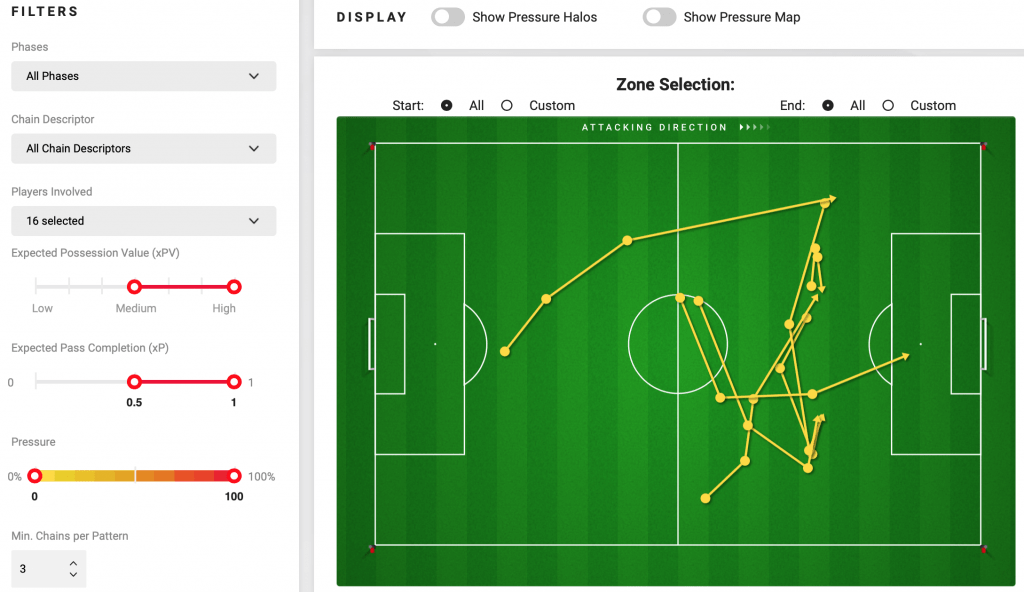
Edge Analysis Example
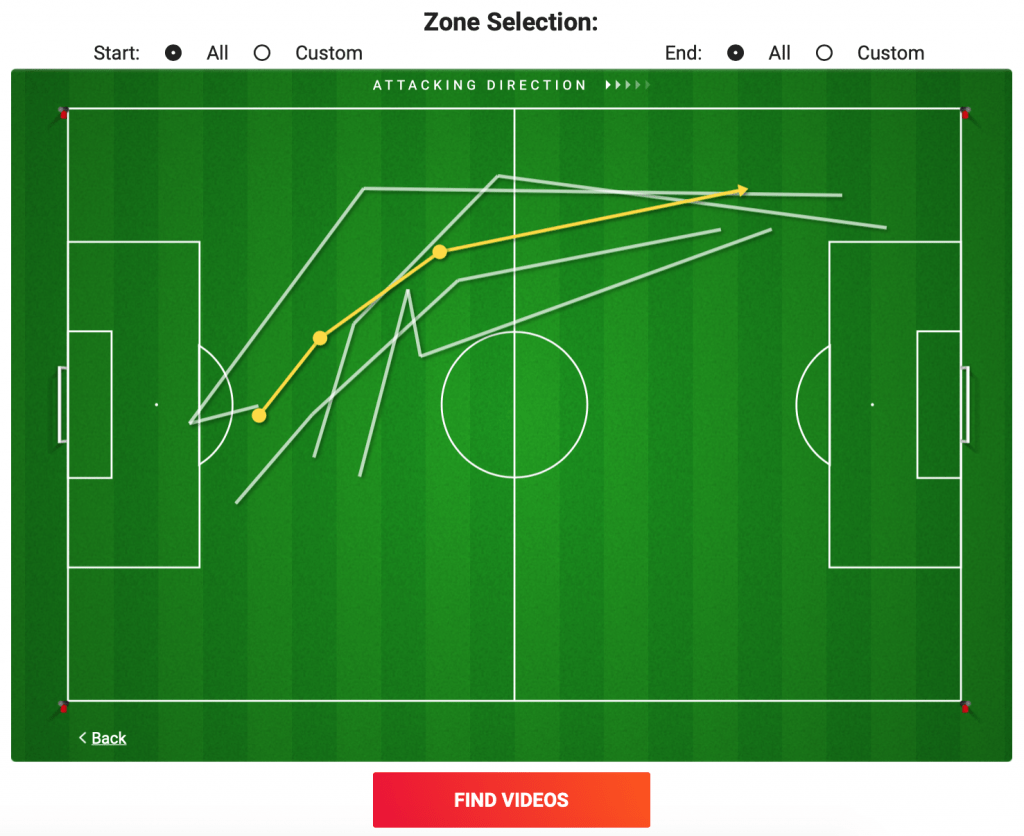
We combine xP with our other AI models – such as Possession Value (PV), Movement Chains, and Pressure – in the Stats Perform Edge Analysis platform to quickly find specific patterns of play and link to video of them. For instance, the example below shows clusters of Movement Chains by Liverpool in 2019-20 in which the average pass was relatively safe (over 0.5 xP) and relatively threatening (medium to high xPV). We can select individual clusters and drill down into the Movement Chains to see, for example, a set of moves satisfying these criteria which start centrally just outside the Liverpool box and move down the left wing before finishing (in a cross, a shot, a dispossession, etc.) just to the left of the opposition box.
Now that we can quantify the difficulty of passes, we can value a player’s passing ability with more context. Two players may have the same pass completion percentage but xP enables us to measure how difficult their underlying passes were, whilst PAx allows us to quantify how skilled they were at completing those passes. By combining xP and PAx with our other advanced metrics, we can build out more sophisticated pass risk-reward-skill profiles for performance analysis and recruitment.
Appendix: Explaining xP Predictions
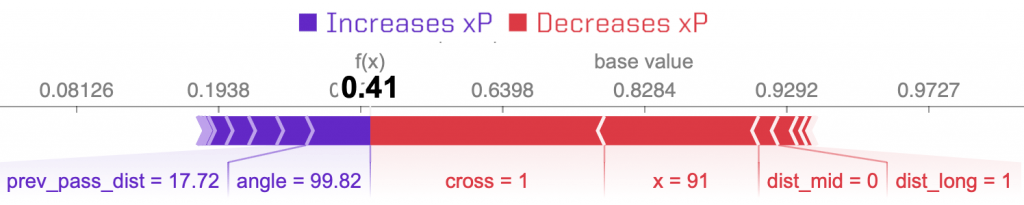
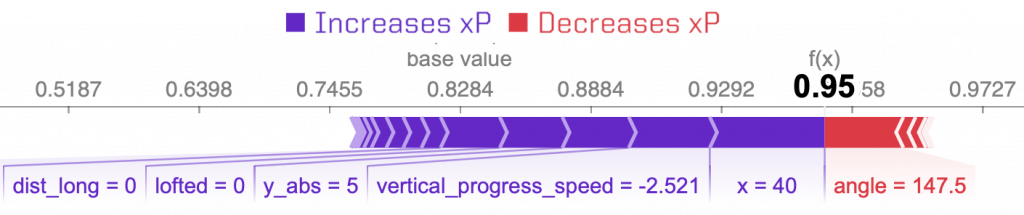
We can get an explanation of how complex models like our xP framework arrive at their decisions using SHapley Additive exPlanation (SHAP) plots. These show the importance of each model feature in terms of positively (blue) or negatively (red) influencing any given predicted xP value. For example, the SHAP plot for Nat Phillips’ 0.95 xP pass in the sequence above shows that the relatively forward angle (angle = 147.5, where 180° is a forwards pass and 0° is a backwards pass) slightly increases the risk of an unsuccessful pass. However, the fact that the ball was played from relatively deep and centre (x = 40, y_abs = 5), was a ground pass (lofted = 0), and came after a relatively regressive passage of play (vertical_progress_speed = -2.521; i.e. Thiago’s free kick moved the ball away from the opposition goal) all greatly increase the predicted likelihood of completion.
On the other hand, for Andrew Robertson’s 0.41 xP pass, the SHAP plot shows that being a cross (cross = 1) and being played deep into the final third (x = 91) greatly decrease the predicted probability of pass completion, although the fact that it’s a relatively square (as opposed to from deep) ball (angle = 99.82) and that the previous pass was relatively long (prev_pass_dist = 17.72) reduce the risk of failure slightly.