The efficiency versus expected (EVE) model takes the concept of measuring a team’s efficiency by comparing success on every single play to a league average based on situation and opponent to another level. Check out our EVE leaderboard here.
In recent years, catch-all metrics that measure a team’s efficiency on both sides of the ball have gained popularity with fans and become mainstream in the media.
Think of it as kind of a wins above replacement number at the NFL team level. DVOA and EPA have become one of the most recognized versions of this metric.
But we’ve introduced an efficiency versus expected (EVE) model that has taken the concept of measuring a team’s efficiency by comparing success on every single play to a league average based on situation and opponent to another level.
We look at down, distance, yards from goal, quarter, time remaining, and score difference. And using those six factors, we’ve trained a model to predict yardage output for any game situation. From there, we compare the projected yards to the actual yards gained or prevented in those situations.
So if the projected yards for a play are 3.4 and the offense picks up six yards, that team would have a yards added of plus-2.6 on that play. The uniqueness in this model is the ability to look at performance in situations when a certain play (pass or run) is expected.
Another differentiator in the EVE model is that it provides a more accurate reading on quarterback scrambles and where they fit in. For example, we have the ability to call them passing plays instead of running plays, something others do not.
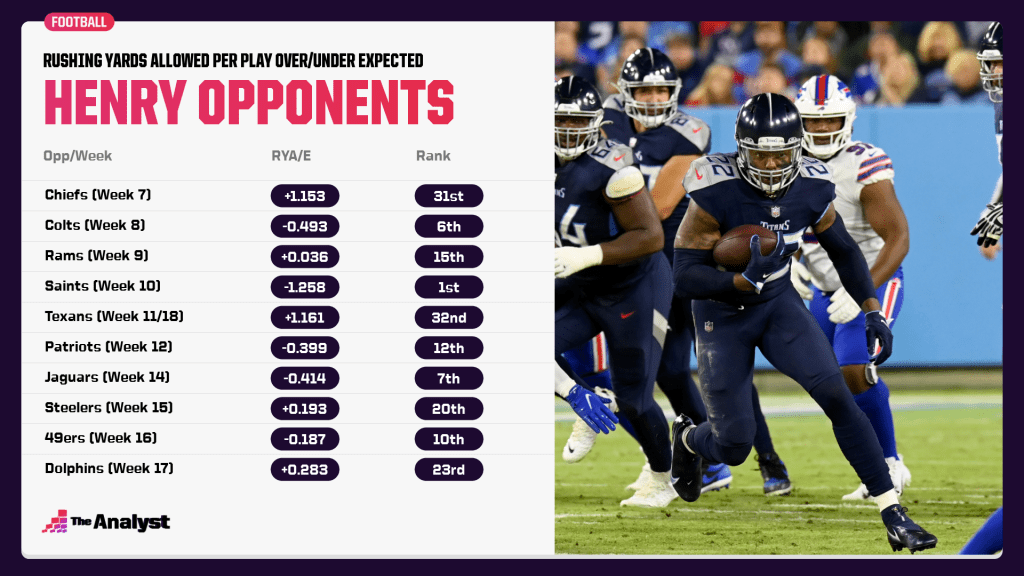
Using our Cover 3 lookahead to Week 7 of the 2021 NFL season as an example, we mentioned that Derrick Henry of the Tennessee Titans had a streak of five consecutive 100-yard rushing games that was the longest by any player in a season since DeMarco Murray ripped off eight straight with the Cowboys in 2014.
We also thought it’d be a good bet that the run would continue against a Kansas City defense allowing 1.153 yards over expected per rush attempt, which ranked 31st in the league. This means on the average run play, the Chiefs were allowing an average of 1.153 yards over the projected amount on those plays.
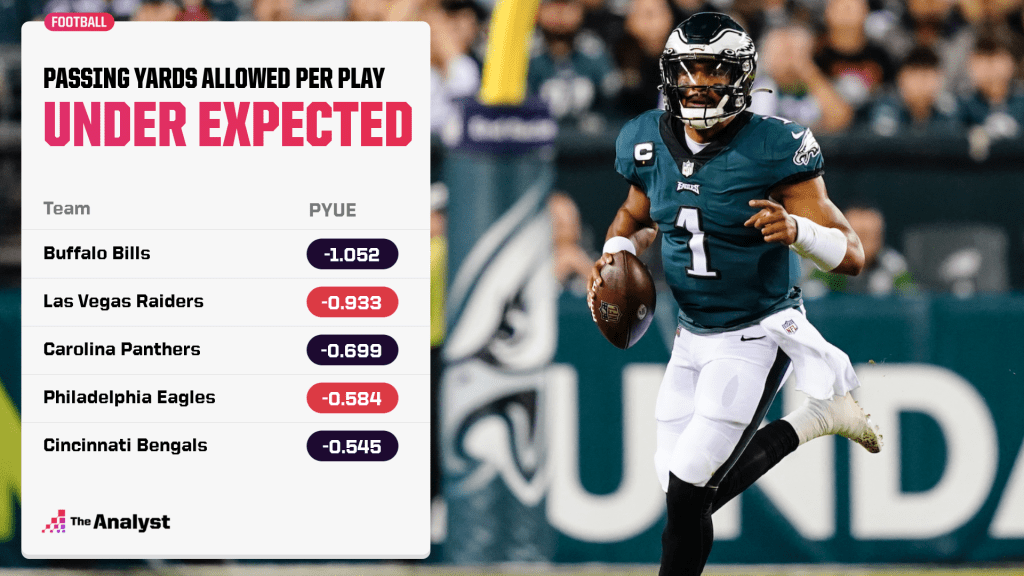
We also noted that Jalen Hurts of the Philadelphia Eagles was trying to reclaim his early-season form, but had a tough matchup against a Las Vegas Raiders team allowing 0.933 yards fewer than expected on passing plays to rank second in the league in that category.
Did we think Henry had a chance to break Eric Dickson’s single-season rushing record?
There were reasons to think so. Entering Week 7, he was set to face five teams (see above) that ranked 20th or worse in rushing yards allowed per play over/under the expected amount, including the NFL-worst Houston Texans twice.
EVE data modeling by Kyle Cunningham-Rhoads.