As a football fan, everybody has their own intuition about what they think the final score of a match will be. If your team concedes a goal or the referee shows a red card, your first thought is often about what’s going to happen in the rest of the game. Can we get a goal back? Will we hold out for the draw?
While you’re not explicitly putting numbers behind these predictions, you are still estimating how likely each outcome is to occur. That is the benefit of our Live Win Probability (LWP) model. It takes into account hundreds of thousands of data points and does the number crunching for you.
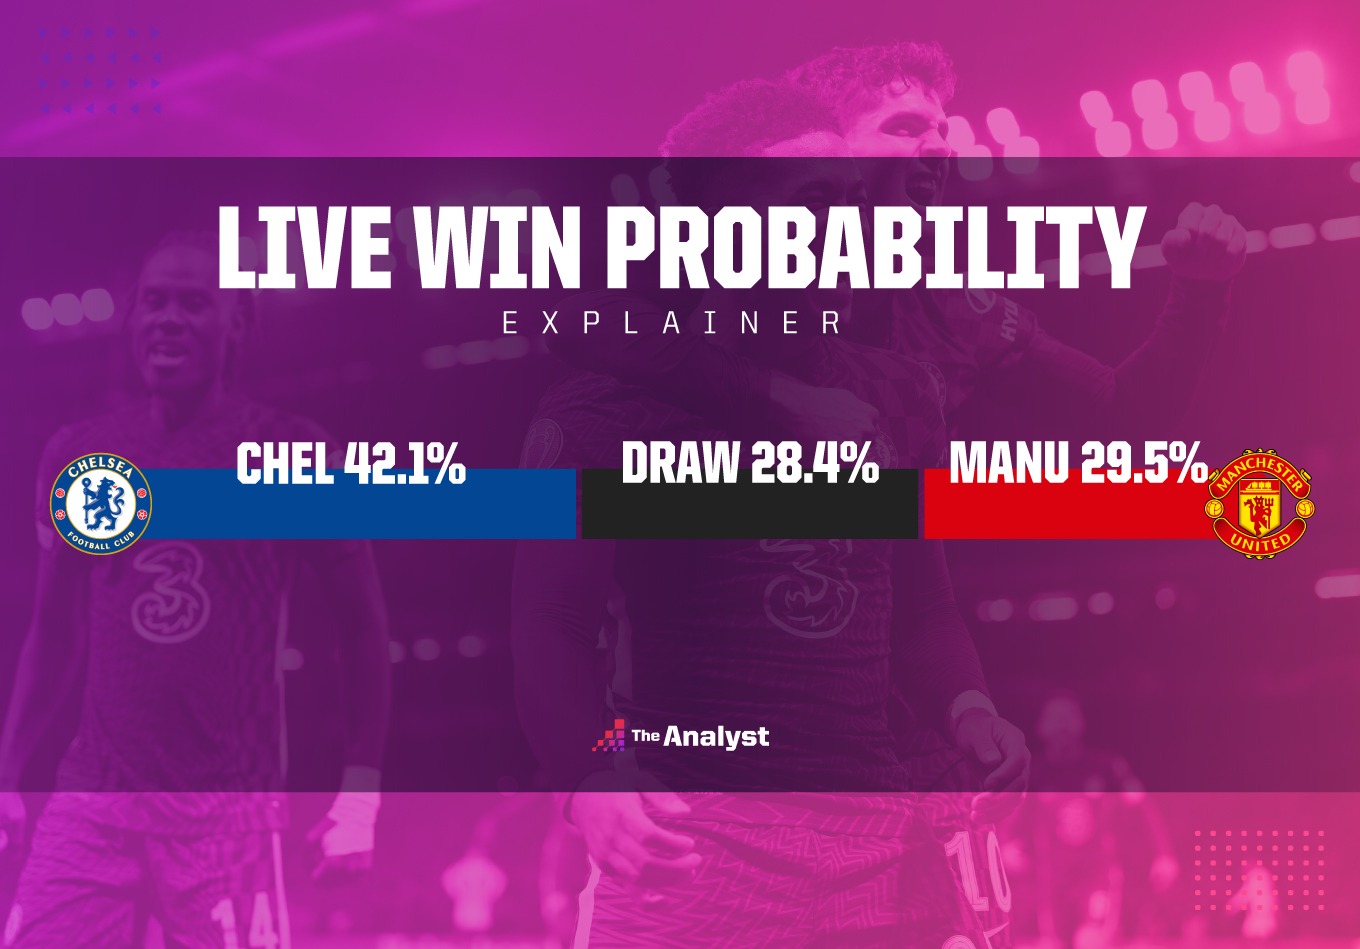
What Is Live Win Probability?
The LWP model predicts the likelihood of each match outcome (win, draw or loss) before and during the match. It allows us to quantify what the most likely outcome is at any time.
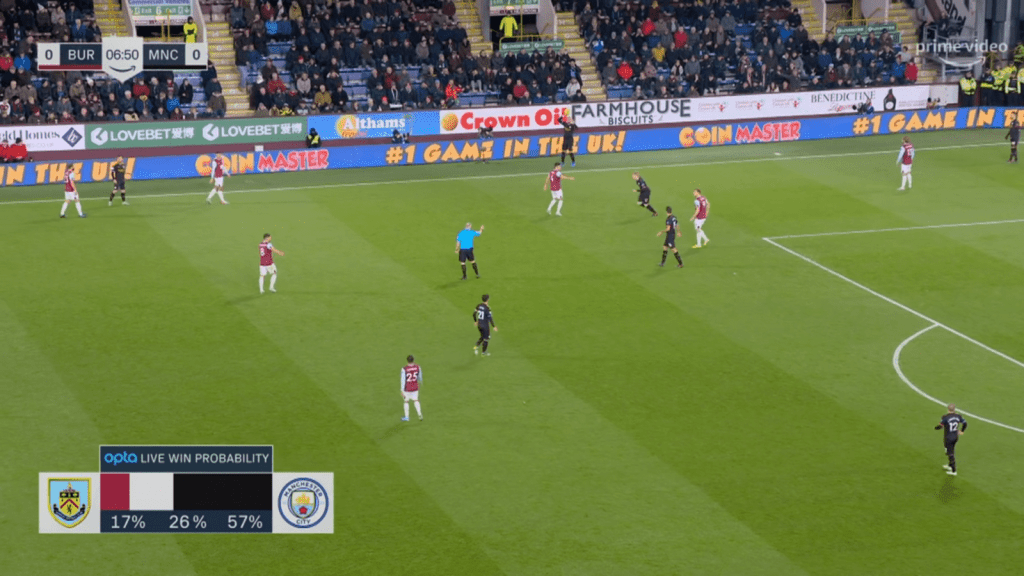
In the match between Burnley and Manchester City, shown above on Amazon Prime Video, the probabilities of each outcome in the seventh minute were:
- Burnley have a 17% chance of winning
- The final result is 26% likely to be a draw
- Manchester City have a 57% chance of winning
How Is It Calculated?
The LWP model calculates the probabilities of each match outcome by simulating the remainder of the match thousands of times. It does this based on how likely the model predicts each team is to score at different points during the game. By analysing the results of each of these simulations, the model returns the probabilities of each match outcome.
The main features that power the predictions are:
- The quality of the teams based on their historic performance over the last four years
- The form of the teams based on their recent performance over the last year
- Whether a team has home advantage
- In-game performance (based on the quality of chances for and against each team)
- The number of red cards given to each team
- The current score
- The time remaining in the match (including an estimate for the expected amount of added time)
The live win probabilities will gradually change as time passes during a match but there are a small set of events that may cause the win probabilities to shift rapidly. These include:
- Goals
- Red cards
- Penalties being awarded
- Missed penalties
- More or less stoppage time being given than expected
Live Win Probability Applications
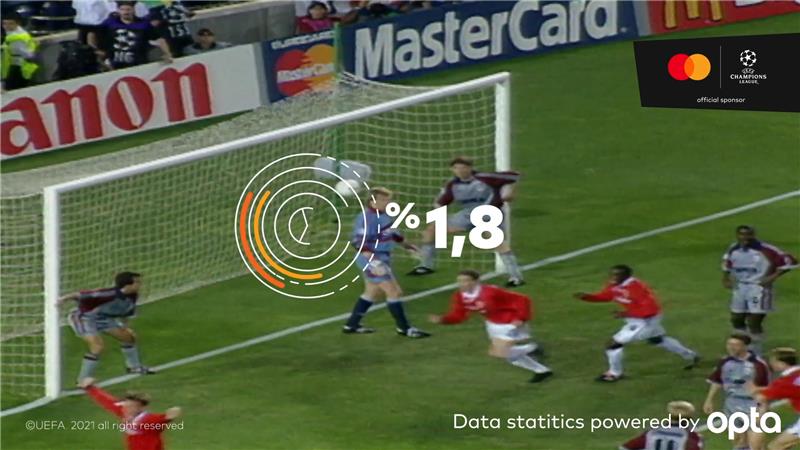
These predictions can give us great data-driven storylines too. In a project with Mastercard earlier this year, we looked back at some of the most unlikely UEFA Champions League comebacks.
One of these included Manchester United’s comeback victory against Bayern Munich in the 1999 Champions League Final. Shortly before Teddy Sheringham’s 91st-minute equaliser, Manchester United had just a 1.8% chance of winning the trophy. A few minutes later, Ole Gunnar Solskjær had secured victory with his famous injury-time goal.
We can quantify and compare some of the most exciting moments in football history (yes, Liverpool’s comeback against Milan was even less likely than this too at 0.6%).
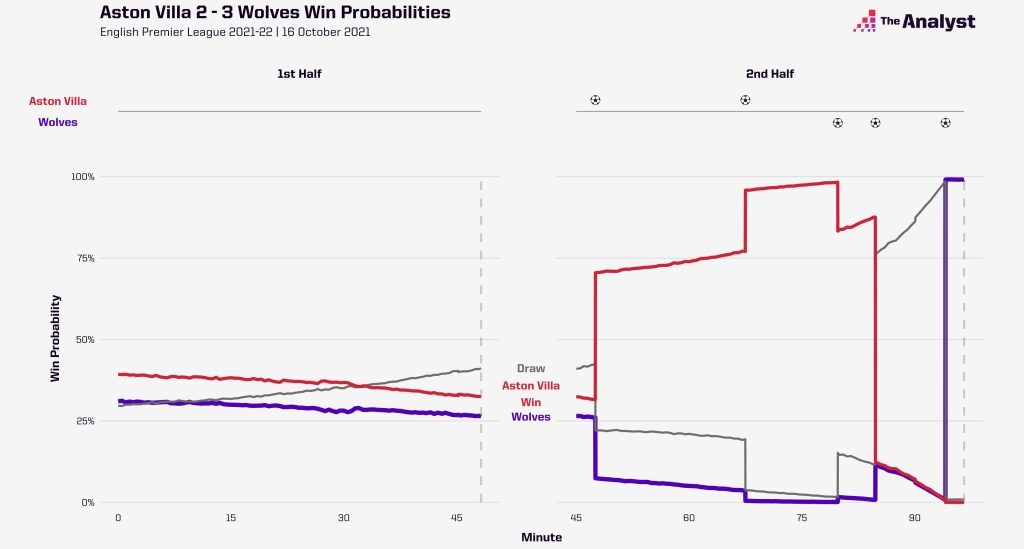
The most unlikely victory so far in the Premier League 2021-22 season came at Villa Park. On October 16, 2021, Aston Villa went into their game against Wolverhampton Wanderers as narrow favourites, with a 39% chance of winning compared to 31% for Wolves.
Villa were leading 2-0 heading into the 80th minute before three late Wolves goals earned them an unexpected three points. So unexpected that, shortly before their first goal, Wolves’ probability of winning the match had dropped below 1%.
While the above storyline would’ve been nearly impossible to anticipate during live coverage, perhaps the more interesting uses of the LWP model are in situations that occur less frequently and so are harder to quantify with gut feeling alone.
As with most of Manchester City’s home games in the Premier League, they were the heavy favourites to win against Crystal Palace in the Premier League on October 30, 2021. The LWP model expected them to win that encounter 76% of the time. This, however, did not go to plan.
City conceded an early goal courtesy of Palace’s Wilfried Zaha but, despite being one-nil down, were still big favourites to make a comeback (City win 55%, draw 24%, Palace win 21%).
While a fan may also come to this conclusion, it is hard to determine just how likely this is without a model’s help. It wasn’t until the 39th minute that the probabilities turned in Palace’s favour.
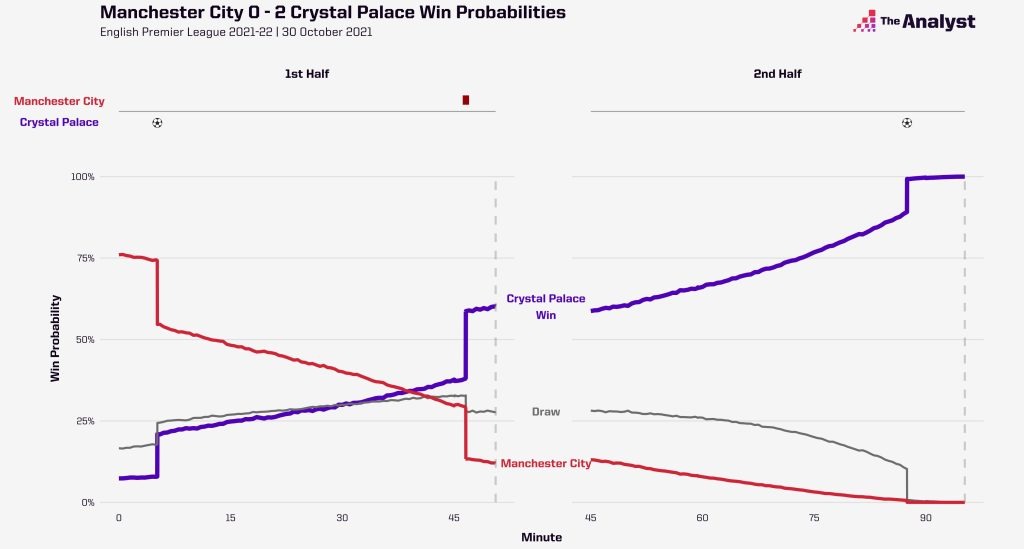
To add to their disappointing Saturday afternoon, Man City’s Aymeric Laporte was sent off in first-half added time. With their new numerical advantage added to their existing goal advantage, Palace’s win probability increased from 38% to 59%.
Given that red cards have only been given once in every eleven games in the Premier League over the last five seasons, models like LWP can help give you a much better idea of how they might affect the game.
Live Win Probabilities can provide audiences with insights like these before kick-off and live during games. The model has been used by Amazon Prime Video and French Broadcaster, Canal+, to do exactly that over the last few seasons.

Enjoy this? Subscribe to our mailing list to receive exclusive weekly content.
Design by Matt Sisneros.