Stat, Viz, Quiz is the weekly Opta Analyst football newsletter. Our latest edition includes numbers on El Clásico, Premier League game state, and Manchester United forwards.
Some of our favourite things come in halves. Half a lager, half a dozen eggs, half and half scarves… Okay, maybe not everything.
With the Premier League on its winter break, we only got half a matchday from Friday to Sunday, but we weren’t exactly short-changed.
That being said, we’ve decided to kick things off in Spain (or Saudi Arabia) this week by looking at the Supercopa de España final between Real Madrid and Barcelona.
Never fear though Premier League fans, we’ll also be looking at which teams have spent the most time in the lead, level and behind in games this season.
No half measures from SVQ this week. We don’t need a winter break, though it could be argued that writing a weekly newsletter isn’t quite as physically draining as playing elite football… aargh! Finger cramp!
If you haven’t done so already, you can subscribe below and receive Stat, Viz, Quiz direct to your inbox every week.
STAT – Vinícius Claims Clásico Treble
We were treated to an extra Clásico when Real Madrid and Barcelona both advanced to the final of the Supercopa de España in Saudi Arabia, which seemed like excellent news all round for football fans.
And it was, unless you happen to support Barcelona.
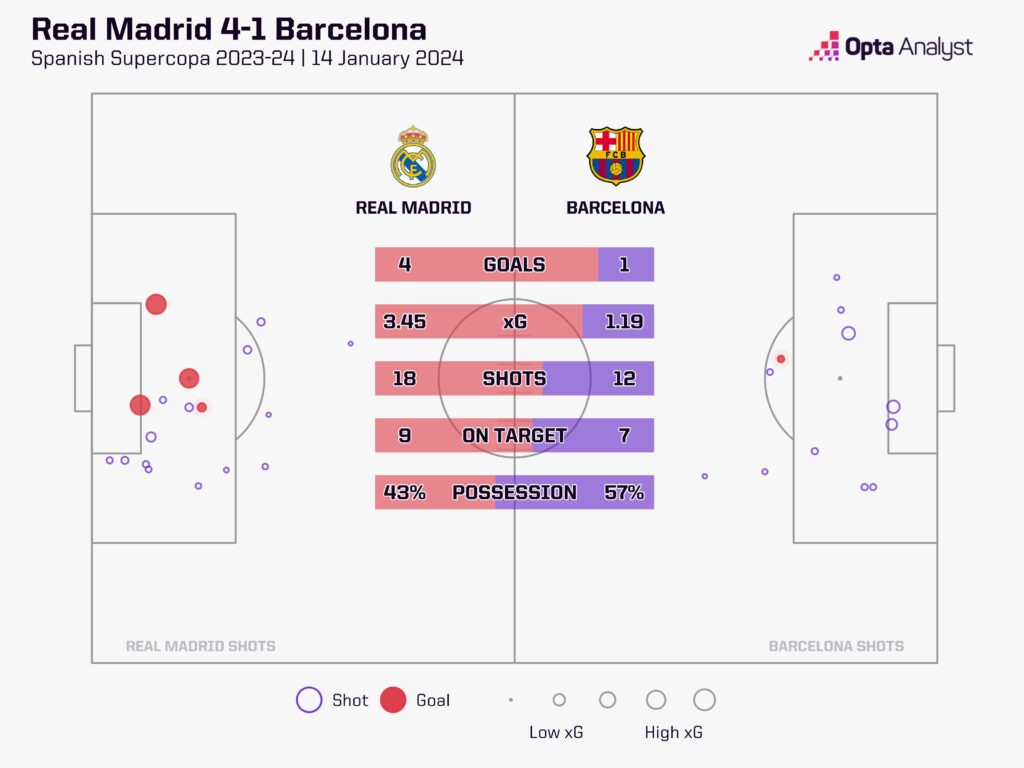
A hat-trick from Vinícius Júnior and another goal from Rodrygo gave Carlo Ancelotti’s men a comfortable win, with Robert Lewandowksi’s excellent strike ultimately a consolation in Real Madrid’s 4-1 victory in Riyadh.
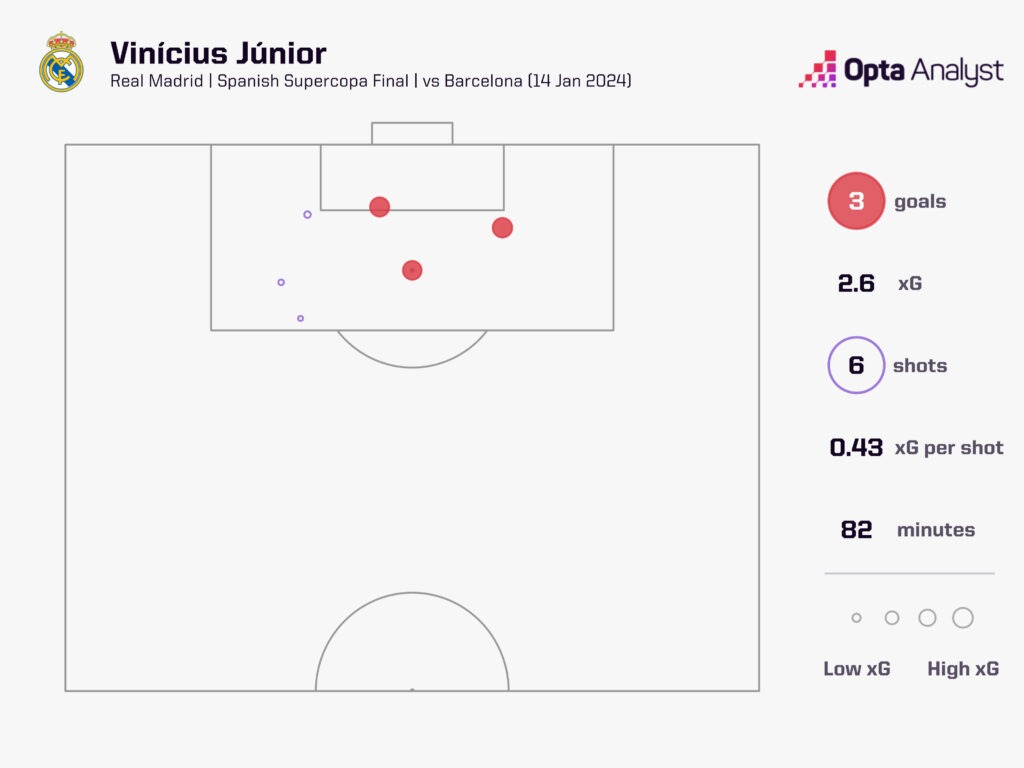
The treble from Vinícius was just the 18th hat-trick in El Clásico history, joining the likes of Ferenc Puskás, Gary Lineker, Romario, Lionel Messi, Luis Suárez and Karim Benzema in firing three in one game against the old enemy.
With there being just 32 minutes between his first and third goals (7th and 39th minutes) it was the second-quickest Clásico treble ever, behind only Madrid’s Jesús Narro, who scored his three goals against Barça in January 1951 in 21 minutes (between the 8th and 29th minutes).
The Brazilian slips in ahead of Iván Zamorano, who scored a hat-trick against the Blaugrana in January 1995 between the 5th and 39th minutes (34 minutes), suggesting there must be something about Los Blancos facing Barcelona in January.
Vinícius took his three goals from an overall expected goals (xG) total in the game of 2.6, with his first and third goals tap-ins after Madrid broke Barça’s high line, before he tucked away a penalty after being fouled by Ronald Araújo, who was later sent off for two bookings.
With Real Madrid seven points ahead of fourth-place Barcelona in LaLiga – albeit a point behind leaders Girona having played a game fewer – the Clásico perhaps doesn’t have the significance it usually does this season.
That won’t take any of the shine off a fine effort from Vinícius, though.
VIZ – Manchester City, Kings of the Game State
Game state, it’s what football’s all about. I mean, quite literally, the state of games is the thing we care about most, though admittedly largely the state of it when the final whistle goes.
We don’t mean ‘state’ as in “Look at the state of that shower of useless…” but whether a team is winning, losing or drawing in a game.
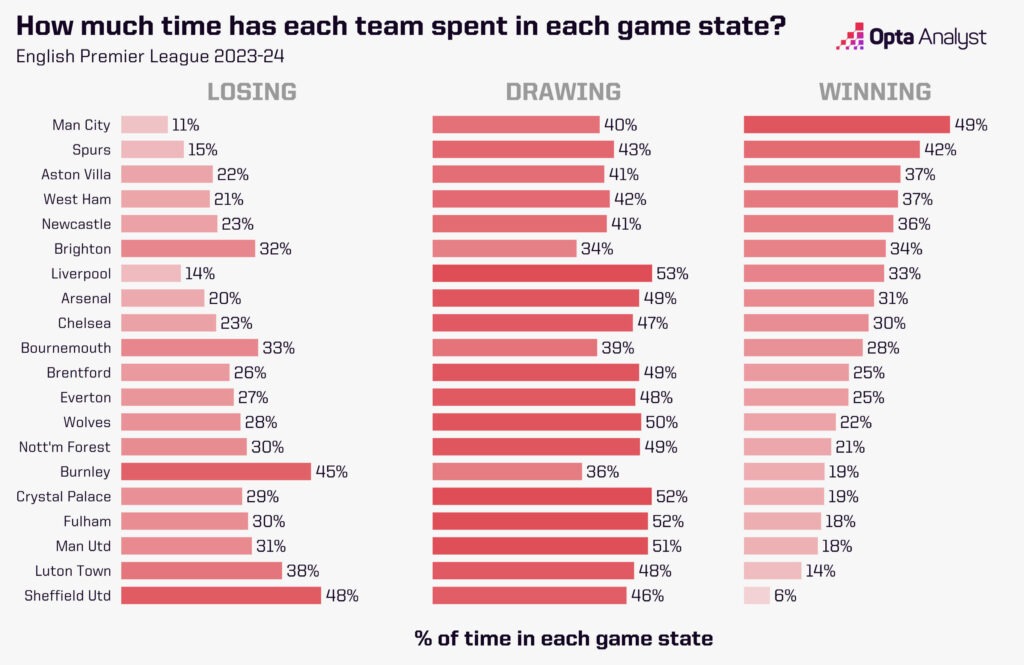
It will probably not surprise many to learn that, in the 2023-24 Premier League so far, Manchester City have been behind for the lowest proportion of their game time (11%). That would have been even less had they not been 2-1 down at Newcastle United for 37 minutes on Saturday before Kevin De Bruyne made football look like the easiest thing in the world to turn it around for the defending champions at St James’ Park.
There are some interesting sub-stories from the above viz, though.
Liverpool lead the Premier League despite having been drawing games for longer than any other team (53%), and only being ahead for 33% of the time, less than six other teams including West Ham and Brighton. However, Jürgen Klopp’s men are good at not being behind, with only Man City losing for less time than their 14%.
Brighton have been the most all-or-nothing team, only drawing for 34% of the time, winning for 34% and being behind for 32%, meaning they are incredibly difficult to predict. There is almost an exact one-in-three chance they’ll be winning, losing or drawing at any time.
The bottom end of the table is perhaps more predictable, with Burnley (45%) and Sheffield United (48%) being behind for the longest time. In fact, the Blades have only been leading for 6% of their games, so next time you’re ahead in a match Sheffield United fans, please do enjoy it while it lasts.
We have to talk about Manchester United, though, and this time it’s not necessarily a criticism. Erik ten Hag’s men have been almost exclusively winning or losing every game this season, until recently. Their 0-0 draw at Liverpool last month and the 2-2 home stalemate with Tottenham on Sunday are their only two draws in 21 league games (W10 L9), despite their game state across those games being a draw for 51% of the time, with only three teams drawing for longer.
All that matters is the score at the final whistle, though, of course.
QUIZ – Swiss Stars, De Bruyne’s Range, and Coleman’s Record
There may have only been five games in the Premier League this week, but we only need five questions, so it all worked out rather well, really. Answers at the bottom of the page.
1. Zeki Amdouni found the net for Burnley against Luton on Friday, his fourth league goal of the season. Who are the only two Swiss players with more goals in a Premier League season?
2. Following their 1-0 win over Fulham, over half of Chelsea’s Premier League wins this season have come since the start of December (five of nine). Who are the only team to have picked up more points in the competition than their 15 in that time?
3. Of Kevin De Bruyne’s 65 Premier League goals, 28 have come from outside the box. Of players to score at least 50 goals in the competition, who is the only player to have recorded a higher percentage from distance than the Belgian (43%)?
4. In Everton’s 0-0 draw with Aston Villa, Séamus Coleman made his 355th Premier League appearance. Whose record for appearances in the competition for the Merseyside club did he beat?
5. Rasmus Højlund’s fine strike against Tottenham on Sunday was Manchester United’s earliest Premier League goal at Old Trafford (2 minutes, 32 seconds) since who found the net early on in December 2020 against Leeds United?
Ask Opta
This week’s question comes from Muritala Azeez (@Az_Constitution) who asks: “Is there truly an increase in the output of Højlund and Rashford?”
Do you have a stat-based question you’d like Opta to answer in a future edition of SVQ? Email us at editors@theanalyst.com or message us on X @OptaAnalyst with #AskOpta and we’ll pick the best one.
Answer:
In terms of goals, yes. Looking just at their Premier League numbers this season, prior to December, Marcus Rashford had scored two (0.18 per 90 mins) and assisted one (0.09 p90) in 12 games (all starts), while Rasmus Højlund was yet to score in nine appearances (eight starts).
Since the start of December, Rashford has again scored two (0.46 p90) and assisted one (0.23 p90) in eight games (four starts), while Højlund has also scored two (0.38 p90) and assisted one (0.19 p90) in seven appearances (five starts).
However, in terms of xG, Rashford has actually gone down quite a bit, with an average of 0.41 xG per 90 minutes prior to December and just 0.09 per 90 since. Despite breaking his duck against Aston Villa last month and adding another against Spurs on Sunday, Højlund’s xG per 90 has gone down from 0.34 to 0.13 in the same timeframe.
If you include creativity in their output, Rashford’s numbers are also not too favourable in recent games.
Before December, the England international had created 15 chances in total and 12 from open play for his Manchester United teammates in the Premier League. Since the start of December, he has created just one chance in total (which was from open play), going from 1.31 chances created per 90 down to just 0.23.
Højlund, on the other hand, created seven chances (all from open play) before December and has created six since, with his per-90 rate going up from 0.97 to 1.14.
All that said, if the goals and assists are starting to arrive, the other stats won’t particularly matter to manager Erik ten Hag right now.
What Are We up to at Opta Analyst?
Here’s some of the latest data-driven offerings you can find on our website:
🔴⚪️ The Russell Martin Project: Southampton’s Record-Breaking Promotion Charge is Fully Underway
🔵 Will Kevin De Bruyne’s Return Decide the Premier League Title Race?
⚽️ Manchester United 2-2 Tottenham Stats
📈 Who Will Win the Premier League in 2023-24?
📉 Who Will Be Relegated from the Premier League in 2023-24?
👀 Player Comparison Tool: Opta Player Radars
Opta Player Ratings & Games
If you haven’t done so yet, check out and play Opta’s new and FREE weekly football challenges, Opta Max and Opta Five.
Both games are powered by the Opta Player Ratings, a measure that takes into account over 100 different metrics to provide an accurate performance score (out of 100) for every player in a single match.
In Opta Max and Opta Five you can compare players’ latest players ratings and stats. Then put your player ratings knowledge to the test for a chance to win big prizes each week of the football season.
Head to the website to find out more and start playing Opta Games.
Quiz Answers
1. Xherdan Shaqiri (8 in 2017-18, 6 in 2018-19) and Granit Xhaka (7 in 2022-23)
2. Liverpool (17 points)
3. David Beckham (55%)
4. Tim Howard
5. Scott McTominay (1 min, 7 seconds)
Before you go…
Enjoying Stat, Viz, Quiz? Think it needs improvement? Send us your feedback to editorial@theanalyst.com.